In addition to helping you explore your data to research trends, Rhiza Premium is a powerful tool for sharing your research with others in your company and with clients. Once you create a presentation, you can save it in the system. All of your data, visualizations, and customizations are preserved. Since the presentation is saved in the cloud, you can access it from anywhere as long as you have a supported browser and an internet connection. You can also generate and download a PowerPoint version of your presentation to share with others offline.
You can start a presentation from the Sales Explorer or the Presentations tab.
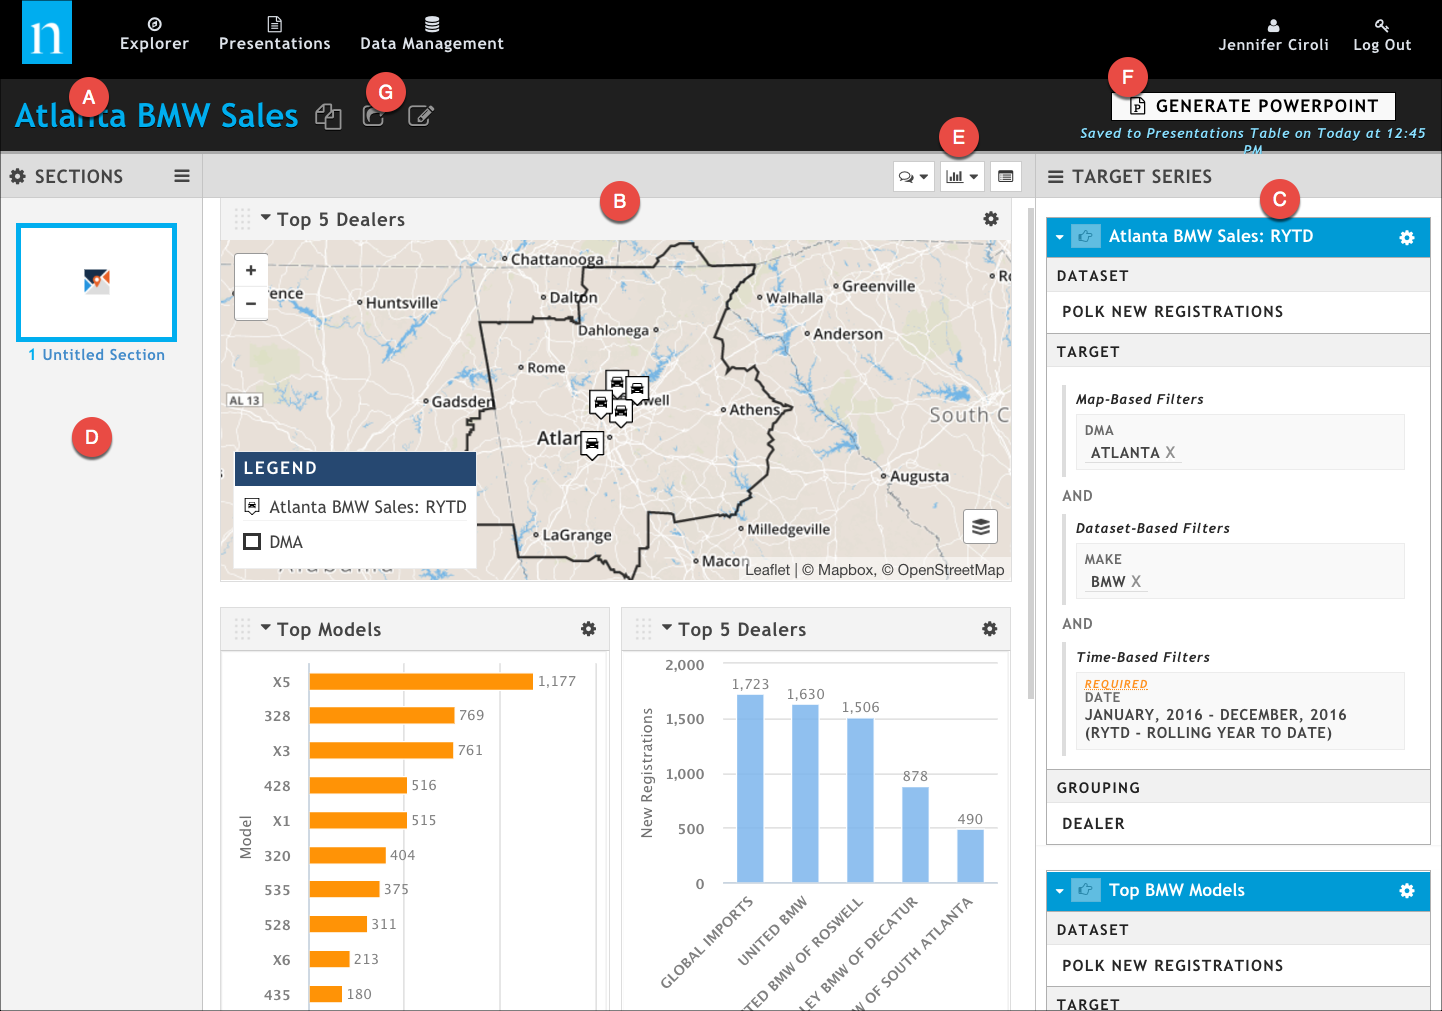
Use the graphic above to help orient you to the workspace.
(A) Titles: Both the presentation and section titles can be customized. Simply click the current name and start typing your new name in the edit field that opens.
(B) Visualizations pane: All of your visualizations are in this area. You can use the presentation options (E) to add additional visualizations, add a section note, or create a template.
(C) Target Series pane: All data-related information is in this pane. Use it to specify the dataset, define your target series, and set the grouping you want to aggregate to.
(D) Sections pane: Presentations can be divided into multiple independent sections. Sections can have different datasets, different filters, and different visualizations. Each section is represented by a thumbnail in the left panel of the page.
(E) Presentation options: These presentation-level actions include the following:
- Add Notes: Add a note to the section; the note stays at the top of the Visualization pane and can be used to provide context for anyone who might use the presentation after it's created. For more information, see Adding Notes To Visualizations.
- Add Viz: Add a new visualization to the presentation. For more information, see Adding And Configuring Visualizations.
- Create Template: Preserve the dataset, visualizations, configurations, and layout for the section so that it can be used to quickly create a similar presentation. For more information, see Templates.
(F) Generate PowerPoint: Use this button to generate a PowerPoint version of your presentation. This button changes to Download PowerPoint once the PowerPoint has been generated.
(G) Share, copy and toggle view options: These actions are also at the presentation level:
- Copy Presentation: Makes a copy of the presentation. The original is preserved. Useful if you want to make a few changes to the original presentation (for example, changing a market, a car dealer, etc.) without losing the old presentation or starting from scratch.
- Share Presentation: Shares the presentation with one or more of the groups you are a member of. If the presentation is already shared, allows you to disable sharing.
- Switch Modes: Lets you toggle between Create and Consume modes. If, for example, you are creating a presentation that is intended to become a template, you can toggle to the Consume mode to see what it would look like before actually creating the template. This allows you to switch back to Creator mode and make necessary change before creating the template.