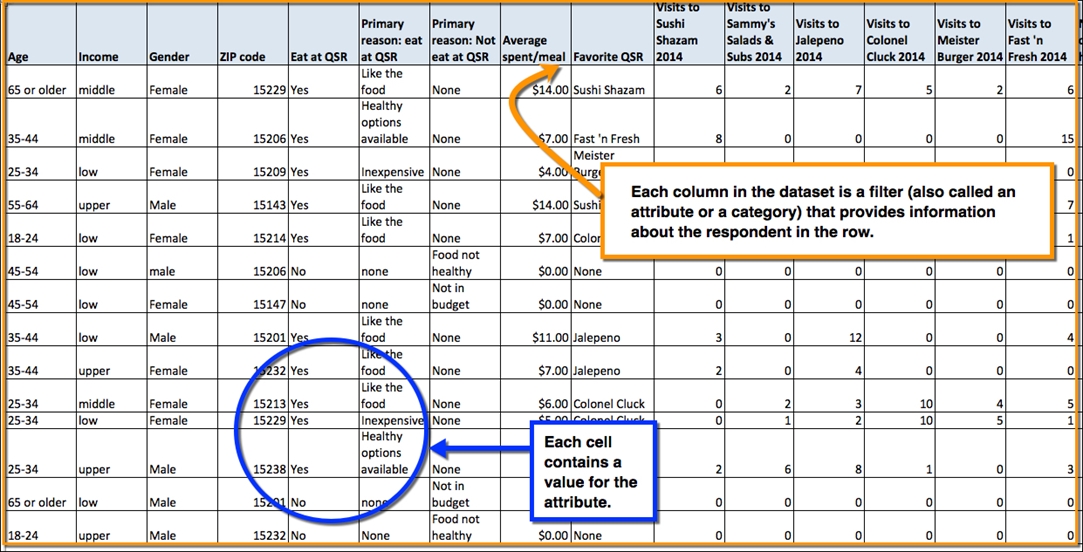
At the core of any research is the dataset, which is an organized collection of related data. The data is formatted into columns and rows.
- A row represents a record in the dataset (for example, a vehicle registration in the Polk New Registrations dataset, or the location of a Dunkin' Donuts® in another dataset). In the case of survey-style datasets like Nielsen Scarborough, each row might represent a specific respondent.
- A column can represent an attribute (sometimes called a filter or a variable) or a calculated value (for example, proportion, weighted individual respondents, etc.).
Data in a dataset can be quantitative (continuous or discrete types), qualitative (ordinal or nominal types), or a combination of both.
- Examples of quantitative data might be the price paid for a new car, the number of times a survey respondent ate at a particular restaurant, or the number of new Hondas a particular car dealer sold last month. All of these values are numbers.
- Examples of qualitative data might be a specific make of car (for example, a Honda Odyssey), demographic information (for example, ethnicity, education level, political affiliation), or ordinal data that indicates the level of satisfaction someone has with a product (a Likert scale is a common kind of ordinal data).
Rhiza Premium supports three types of datasets:
- Survey-style (e.g., Scarborough USA+ and the U.S. Census datasets)
- Star schema (e.g., IHS Polk New Registrations)
- Single table (e.g., Dun & Bradstreet)
Some of these datasets have data available at a granular level (e.g., IHS Polk New Registrations), while others have the data already aggregated (e.g., the U.S. Census datasets).