To use Rhiza Premium, you need a few things:
- One or more target series; each target series contains:
- a dataset
- target filters to narrow down the target (optional)
- a grouping (essentially, a category)
- One or more visualizations, contained within a presentation
- Templates (optional)
The related topics describe how each of these fundamentals play a part in answering your research questions and in sharing your insights across the organization.
Example
Ann has a set of research question she wants to answer in order to help her company decide where and when to show political ads for the upcoming election season. One of those questions is, "What broadcast stations do registered Democrats in Pennsylvania watch?"
First, Ann thinks about what dataset can help her answer this question. She chooses Scarborough Local Market Survey which contains information about voters and their demographics, including geographic location and viewing habits. Because she doesn't want to examine all of the data, she decides to focus only on the Broadcast TV networks/stations watched past 7 days grouping in the dataset. This grouping will return all of the stations listed as values in the grouping. (Because there are so many answers to this question, Ann will need to narrow down her results to the top 10, which she can do once she configures her bar chart.)
Because Ann wants to look only at Pennsylvania Democrats, she needs to create target series filters for two attributes: political party and geographic location. The resulting visualization might look something like the following graphic. Based on this, Ann decides that it would make sense to allocate ad budget to those top networks.
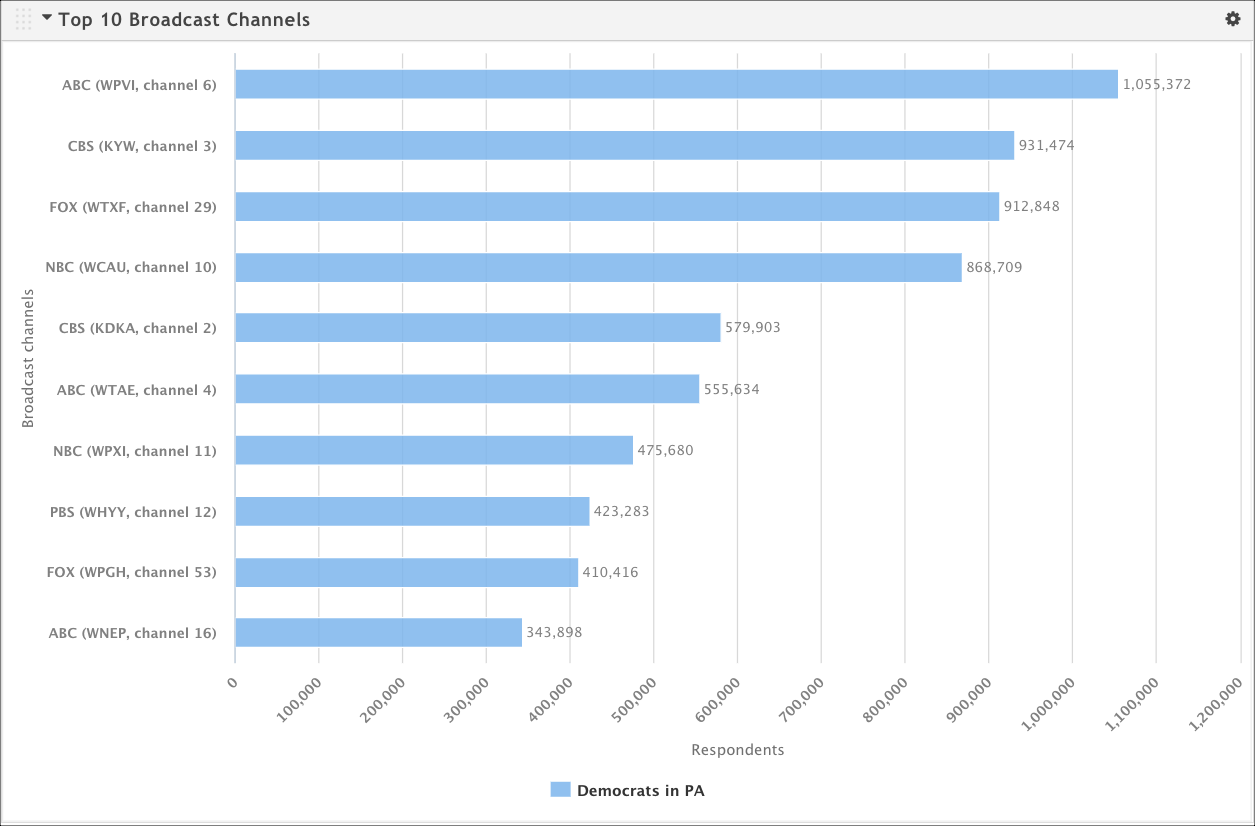
Once you know what data you want to look at, you can create one or more visualization types to represent it graphically. In the example above, Ann decided a bar chart was the right choice for this particular set of grouping and target.
One or more data visualizations can be saved as a presentation so that it can be shared with others. It can also become the basis of a template, which enables you to quickly create similar presentations. If we continue to think about Ann, perhaps she wants to know about the viewing habits of Pennsylvania Republicans. If she creates a template from her current presentation, she can quickly swap out the political party filter and get an updated presentation.