Rhiza Premium
Want to start creating beautiful, insightful graphics based on your data? It's as easy as picking the visualization you want to use, selecting a dataset, and creating the filters to narrow down the dataset to only the information you want to see.
The basic workflow looks like this:
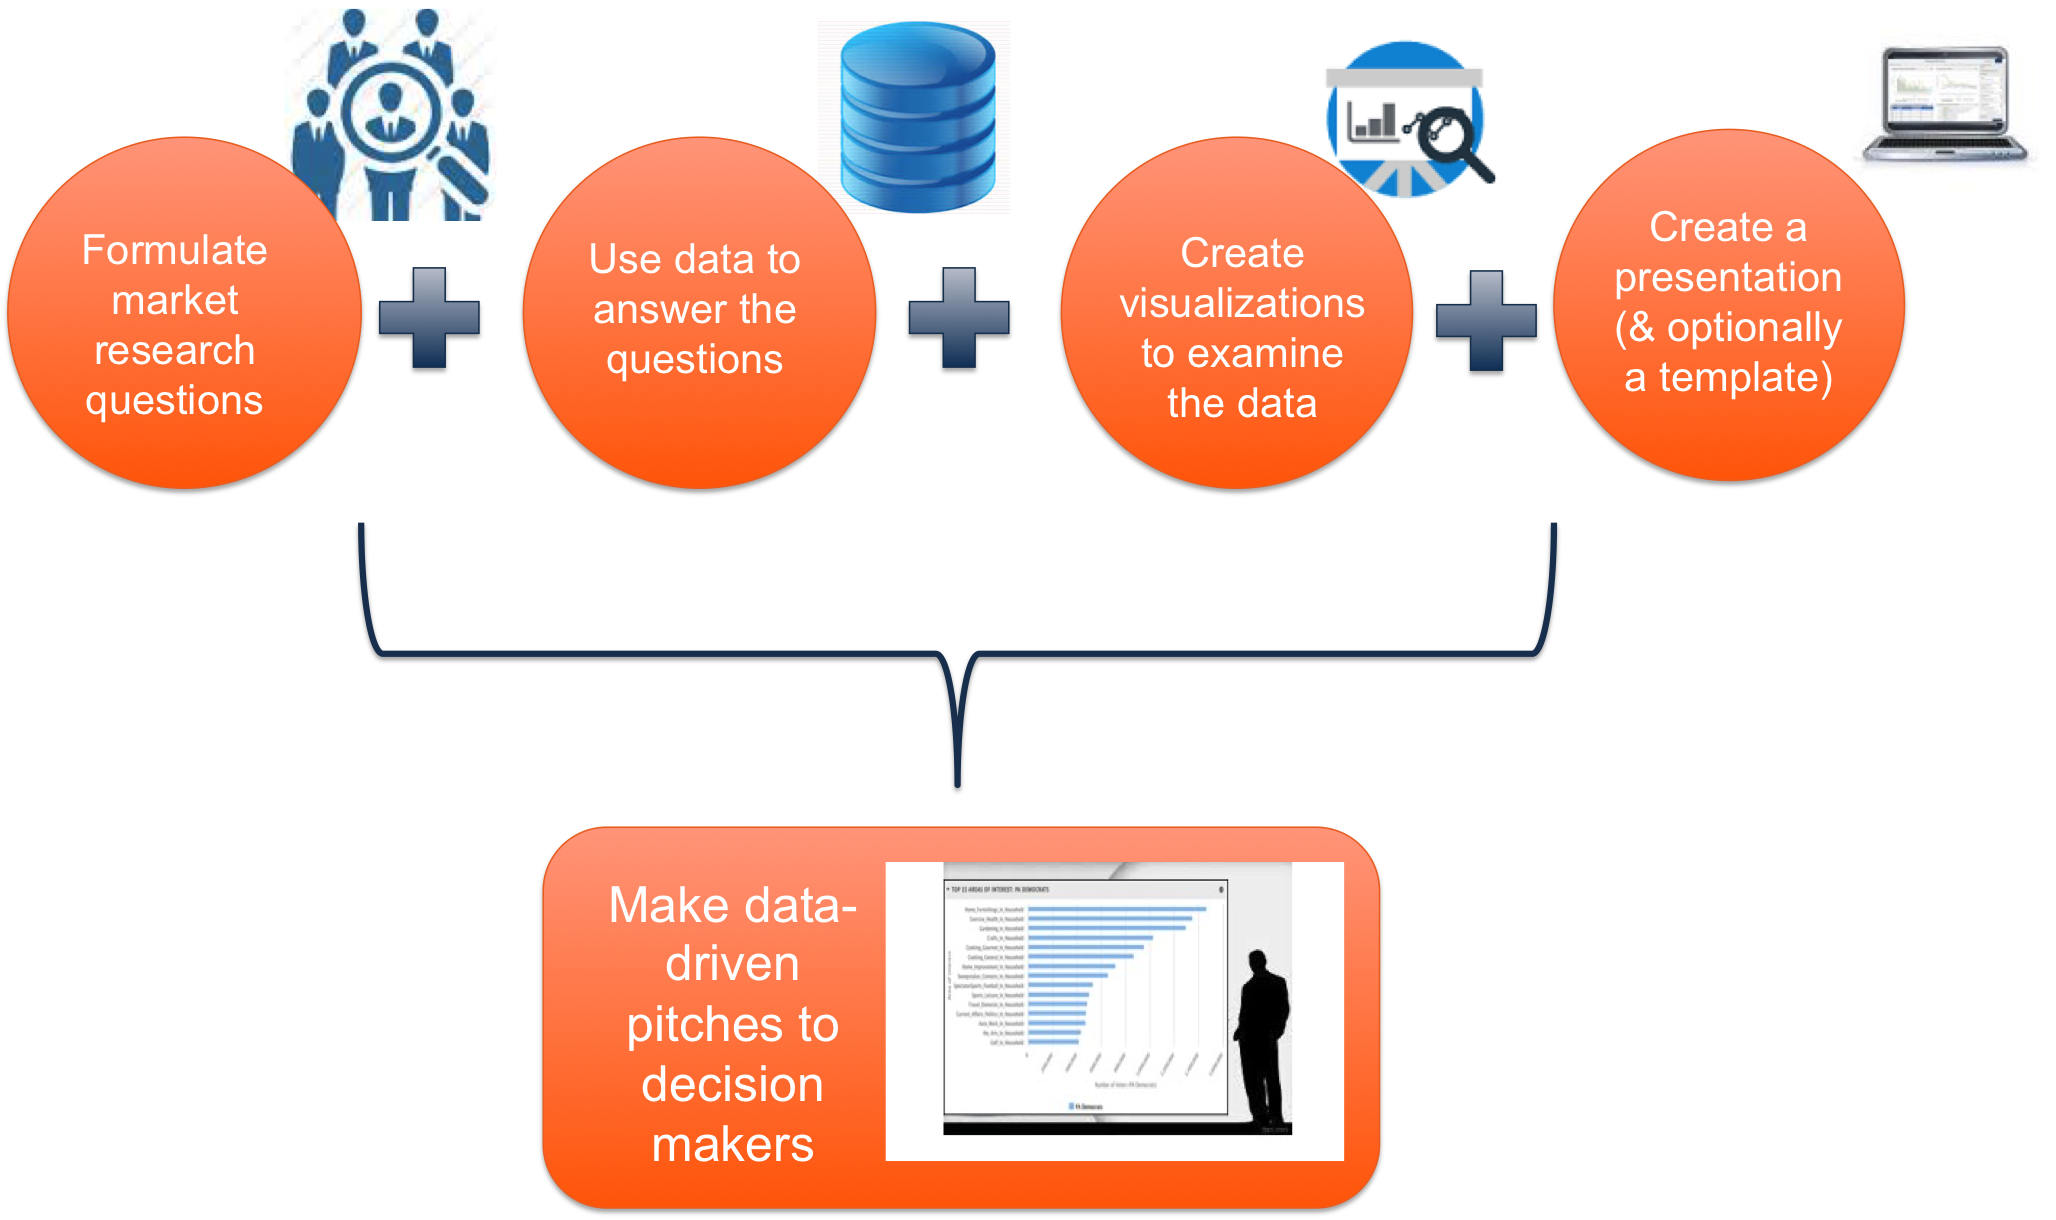
You can also watch our Rhiza Premium Essentials video to understand the basic workflow, or take one of our brief tutorials to create a quick, one-section presentation just to get your feet wet.
A Getting Started Checklist
Of course, with a tool as powerful as Rhiza, you can really dig into the data and visualizations to examine multiple aspects of your story. To get started, we recommend the following checklist:
Understand the basics
Learn about or upload data
Start a presentation
Refine your presentation
Create a template
Generate a PowerPoint® version of your presentation