A target series is a combination of a dataset, a target, and a grouping.
Datasets are often enormous and there are times when you don't want or need to look at the whole thing to answer your research questions. When constructed carefully, target series filter down the data to only what you want to see.
A target is a type of data filter that groups together related attributes. Use it to define the people or things that you want to know about (for example residents of Pittsburgh between the ages of 18 and 45, or the number of registrations for a particular dealer).
A grouping is also a data filter; it categorizes or aggregates the target series results by a particular characteristic. That characteristic might be temporal (e.g., aggregating results by month, year, or quarter), geographic (e.g., aggregating results by state, ZIP Code, or target market), or demographic (e.g., aggregating by age, gender, income, or other personal traits). So, to go back to the example we used in the last paragraph, if you have targeted residents of Pittsburgh between the ages of 18 and 45 (the target), you might want to learn about their political affiliation (the grouping) to help differentiate or compare them.
Example
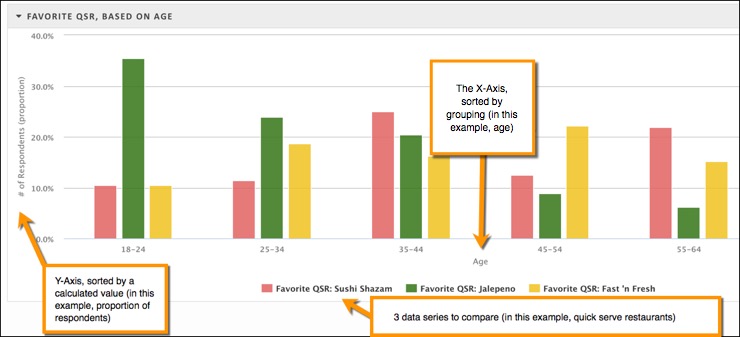
Let's suppose that we wanted to know which of our company's three quick-serve restaurants (QSRs) are preferred by different age groups so that we can more accurately target our advertising.
We already know that we want to use a dataset called QuickServeRestaurant_Trend_2015 that tracks consumer trends and preferences. We will create three target series: each one will use the same dataset, each one will have a different target (one for each QSR we want to look at), and each one will use the same grouping. In this case, we are going to group by the Age attribute in the dataset.
When we create a column chart using that combination of dataset, target, and grouping, we can see that the youngest consumers prefer Jalepeno far more than Sushi Shazam or Fast 'n Fresh, so we might want to concentrate our Jalepeno advertising on media that appeal to the younger consumers.
Target
Remember that a target groups together related attributes so that you can visualize them in a table or chart. In , different types of visualizations handle data series in different ways:
Tables and maps (Research reports): In these visualization types, you can look at one data series at a time. You can configure your table or map to show the specific data series you want to see. You can also add additional tables or maps so that you have one to represent each data series.
In the Geographic Report, however, tables and maps can visualize more than one data series.
Charts: You can look at one or more data series at the same time; use the visualization configuration options to specify which series you want to see in the chart.
It's important to understand how uses the target filters in a target series. As the following graphic shows, there is an AND operation between all attributes in a target. In this example, the target series is going to return only results that have a DMA attribute with a value of "Pittsburgh," a Credit Cards Used Past 3 Months attribute with a value of "American Express," and a Sex of Respondent attribute with a value of "Female."
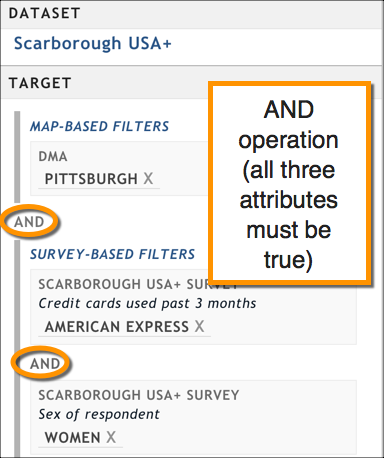
This set of target filters uses only AND Boolean logic. Only those records in the dataset that meet all the criteria are returned.
However, when you specify multiple possible values for an attribute, there is an OR operation for that attribute, as shown in the following graphic. In this example, the target series will return results for females in Pittsburgh who used either American Express, Visa, or MasterCard in the past three months.
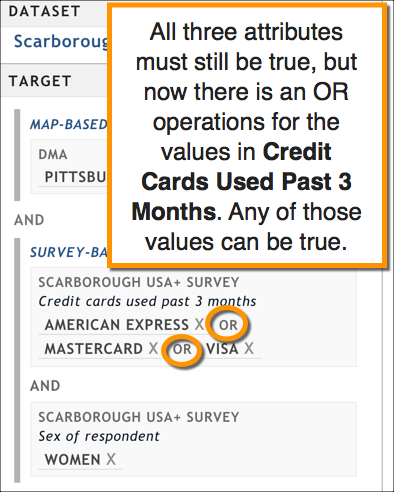
This set of target filters still uses the AND Boolean logic between each filter, but also uses OR logic within a filter.
Grouping
A grouping is a type of data filter that is applied to the results returned by the target filters. In other words, you must narrow down your results via a target before you can sort them using a grouping filter.
In the report, you can apply flexible groupings for survey-style datasets (for example, Nielsen Scarborough USA+); for all other datasets (for example, IHS Polk), you aggregate to a single grouping. What do we mean by a flexible grouping?
Select only certain answers from an attribute (question): Previously, all answers were selected; often, it placed unwanted data on visualizations, especially when there were answers like "none."
Select answers from different attributes (questions): Previously, you could aggregate to only a single attribute. Now, you can select as many different attributes -- and as many (or as few) answers for each attribute -- as you want.
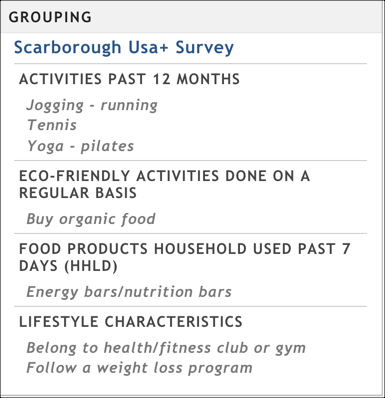
The following graphic shows an example of flexible grouping with a subset of answers from four different attributes, or questions.
Groupings are broken out into the following kinds to help you pick what you need:
- Dataset-specific: These groupings are attributes found within the dataset you are using. If you are using an uploaded dataset, only those columns that you designated as a data type "Category" will be available. Use these with any kind of visualization.
- Map-based: These groupings aggregate your results based on geographic elements. Although you can use them with most visualization types, they really shine when you use them with the map visualization.
- Time-based: The groupings aggregate your results based on time. Use these with any kind of visualization.