When you first log into , you're greeted with the Sales Explorer. From here, you can create data- and visual-rich presentations in a snap by entering one or two values (perhaps your station, or your market) and pushing a button. You can also create your own presentations and templates for others to use.
The Sales Explorer Tab
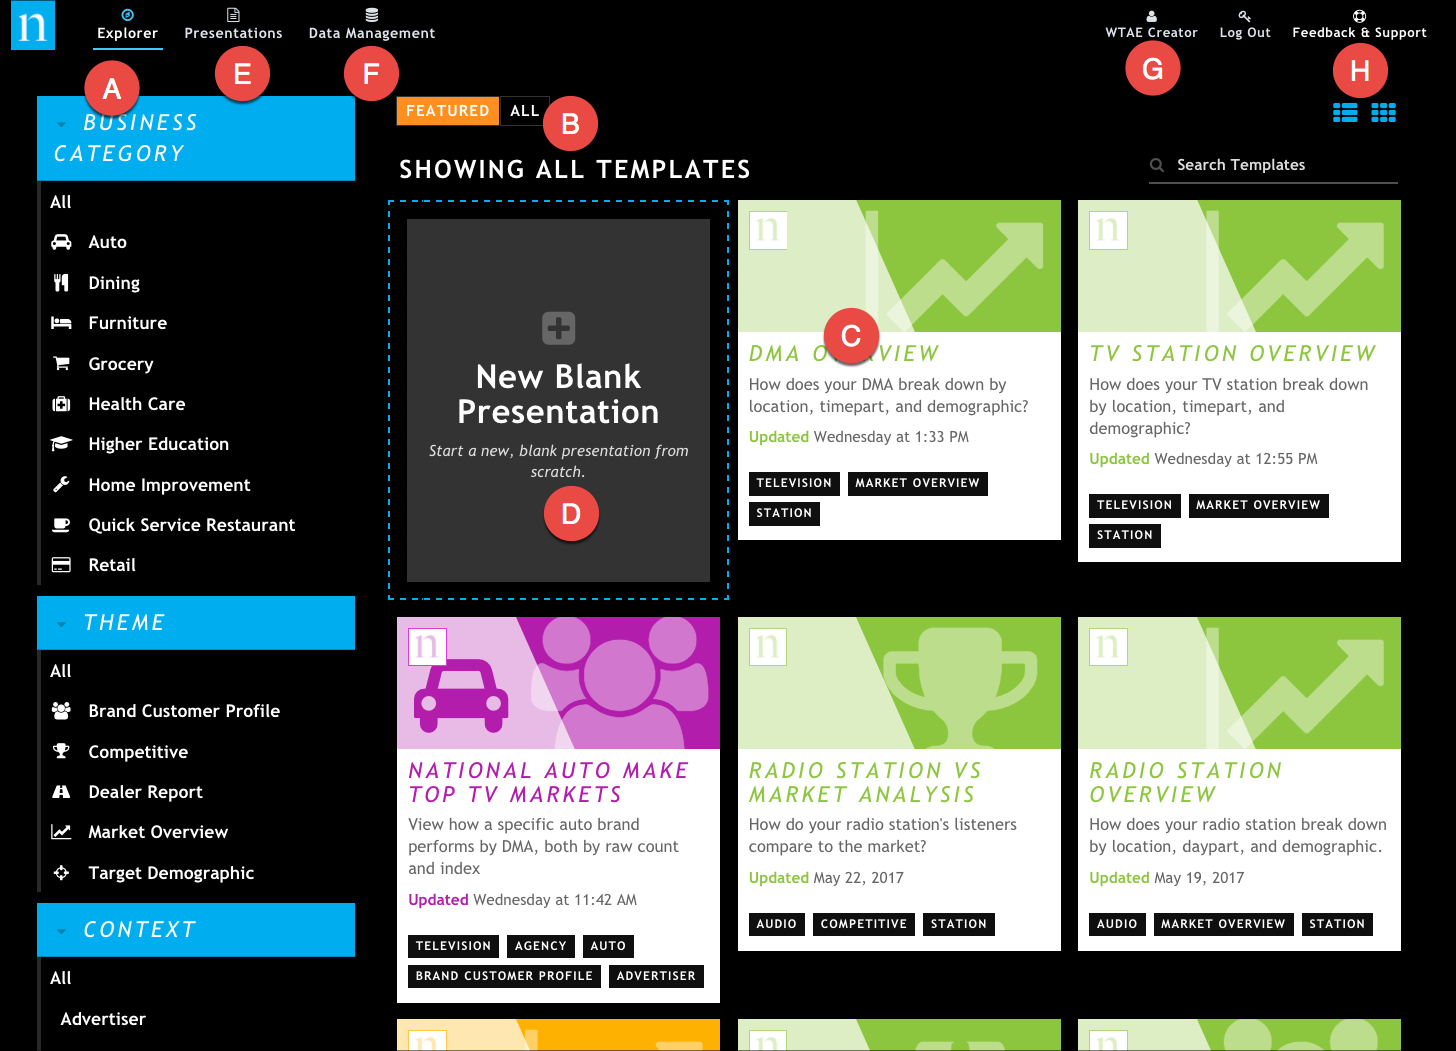
You can dive right in (A) by clicking a template. By default, the featured Nielsen templates (B) are shown. Featured templates are ones that have been created for you by Nielsen and come with support. All featured templates have the N-badge on them:

You can toggle to see all templates, which includes both featured and custom templates. (Custom templates are those created by someone other than Nielsen; they are not supported by Nielsen.) So, for example, if you create and publish a template, it will be available when you toggle to view ALL templates.
The navigation bar on the left organizes the featured templates into the following areas:
- Business Categories: These are business verticals like health care, auto, and home improvement.
- Themes: These help define what kind of information you want in your presentation. Do you want to see customer profiles, or are you more interested in a competitive analysis? Note that some templates can contain more than one theme.
- Context: The point of view you are approaching the presentation from. The context is what gives each template its color.
- Advertiser (purple):" I'm looking at this from a business intelligence perspective of my client's industry"
- Market (orange): "I want to know what forces are at work in my market/client's market"
- Station (green): "I want to know more about my station/my client's station"
Click or tap any item to filter the template list by that item. Note that selecting additional items concatenates your filter -- if you select Home Improvement and then select Retail, your search returns templates for both of those verticals. You need to specifically clear a filter by clicking or tapping it again.
Each featured officially supported template has a description and metadata to help you determine whether it will help you tell the story you need (C). Some custom templates might also have descriptions and metadata, depending on the creator.
You can also start a new presentation (D) from the Sales Explorer.
The Presentations Tab
Use the Presentations tab (E) to manage your presentations, as well as those others have shared with you.
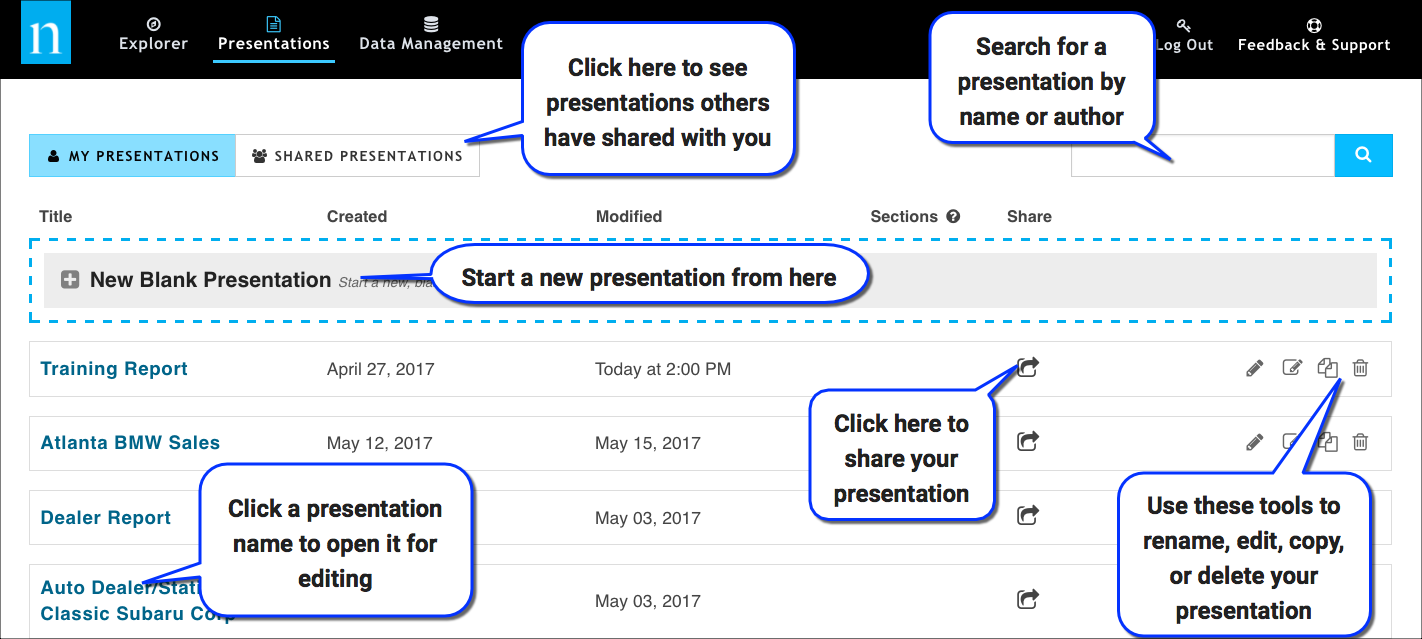
Note: If you do not belong to any groups, the Share icon is not available.
The Data Management Tab
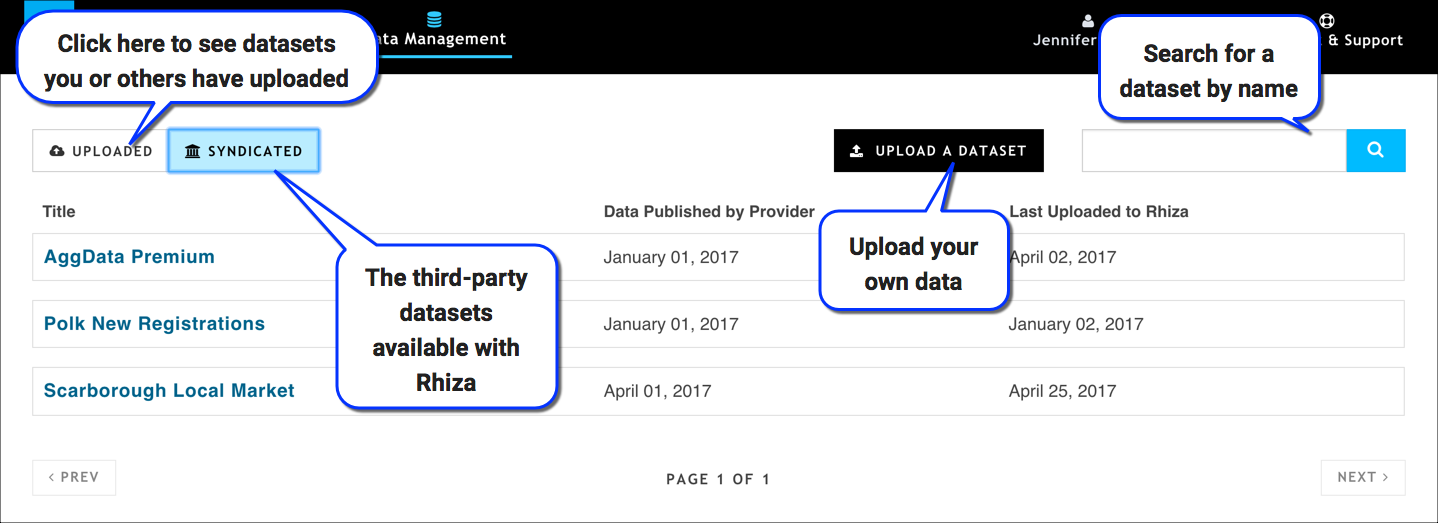
The Data Management tab (F) lets you browse and manage all available datasets. By default, the table shows all of the user-uploaded datasets; you can easily toggle to see the syndicated (third-party) datasets that are licensed with .
In addition, use this tab to upload your own datasets.
The User Settings Tab
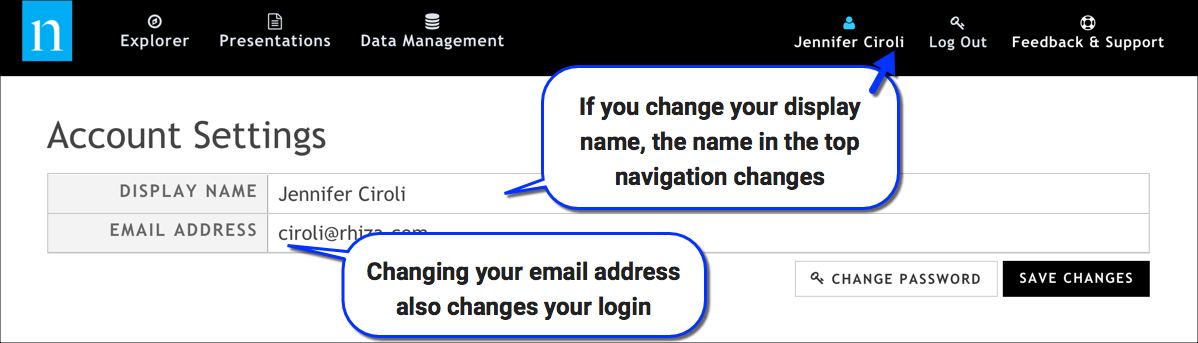
Use this tab (G) to manage your account settings, including your display name and the email address associated with your account. You can also reset your password here.
The Support link
Use this link (H) to access the online documentation and to open a new support ticket.