After you start your presentation, you must specify which dataset you want to use, as well as which target and grouping you want to filter that dataset. Together, these are called a target series, and you must have at least one target series in your presentation.
Make sure you've started a new presentation. See Create a New Presentation.
In the Target Series pane, click Create Target Series to open the Create Target Series Wizard. This is where you will specify everything you need for your target series, including the dataset, the target, and the attributes you want to group by.
Select your dataset:
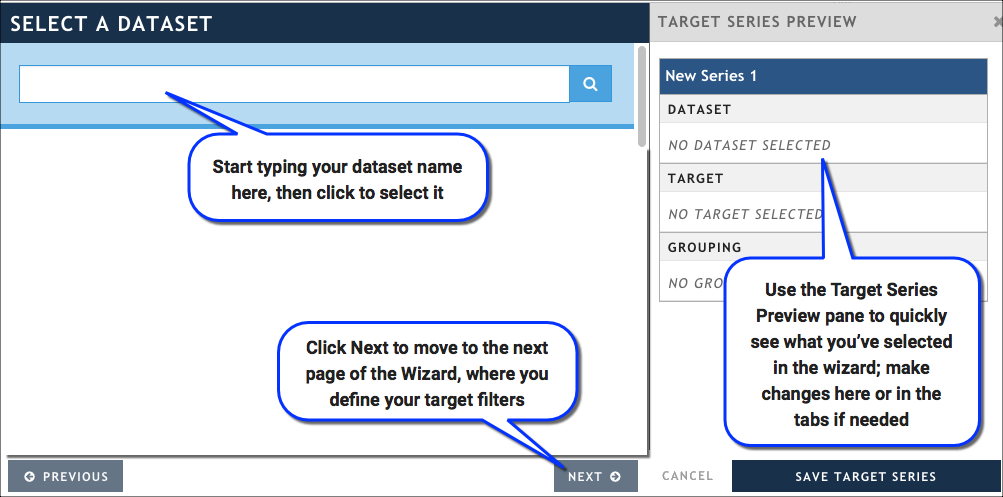
- In the Select a Dataset tab, start typing the name of the dataset you want to use in the search bar. A list of matching datasets appears below the search bar.
- Click the dataset you want to use. You are automatically advanced to the Select a Target tab.
Define your target by selecting the attribute or attributes you want in the Select a Target tab, and then clicking Select a Grouping. Because creating a target can be an involved process, especially if you are using a survey-style dataset, we recommend you read Create a target before moving on to the next step. If you are using linked series, read Creating Linked Target Series.
If you wish to clear the target values for an individual attribute, select the "Clear Filter" button in the upper-right near the filter input.
Advanced user tip: Did you know that you can create an empty target to match all of the attributes and values in a dataset? This is useful if you want to use the entire dataset as the context for a more specific target. See . However, be aware that creating an empty target can increase the processing time required for the visualization.
Specify how you want to group the data on the Group By tab.
- If you are using a non-survey style dataset like IHS Polk, simply choose the attribute you want to use (for example, Dealer, ZIP Code, Model).
- If you are using a survey-style dataset, we recommend you read Group (or aggregate) your data before moving on to the next step.
Rename your target series:
In the Target Series Preview Pane, click on the current target series name (usually Target Series 1) to make it an editable text box.
Type your new name into the box.
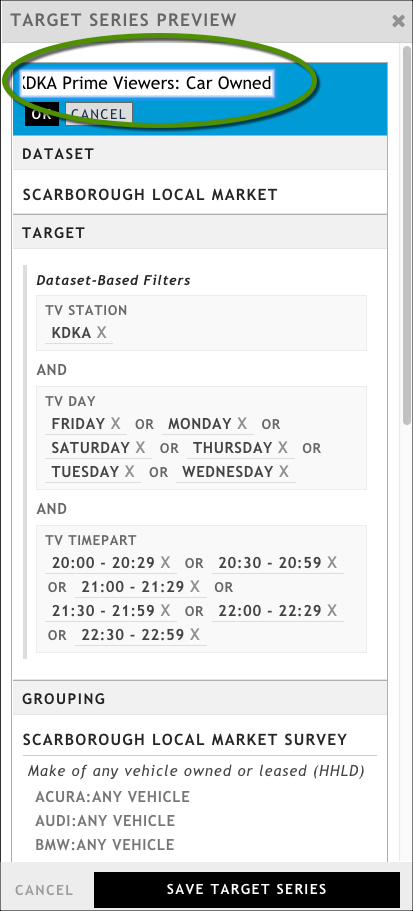
Click OK.
Click Save Target Series to save your work and close the Create Target Series wizard.
Click Update Presentation to see the results in your presentation. It can take a few minutes for the visualization to render depending on the size of the dataset and the scope of the target series you defined.
Now that you have data and a visualization in your presentation, you can configure the visualization you have or add additional target series and visualizations.
Just remember: If you add another target series or edit your target series, you have to click Apply Changes to see your changes reflected in the presentation.