You can use Rhiza to create your own dataset by uploading comma-separated value files (.csv). Once you have created a dataset and added files to it, you can always go back and append more data files or delete old data that you no longer need. Appending data means stitching different data files together. For example: I could create a dataset called Daily Sales. First, I would upload a CSV files with daily sales numbers for January. Come February, I could now add another CSV file with daily sales numbers for February. If I append these files correctly, I will be able to see my total sales for both months in Rhiza. Even after adding and deleting CSV files from a dataset the dataset will stay intact and presentations or templates using your own uploaded dataset will keep working.
Before You Begin
- Read Preparing Data For Upload before beginning this task. It has important information on making sure your file is formatted correctly.
- For best results, datasets should have a maximum of 10,000 rows and 25 columns. If your CSV file is too large and it fails to upload, please contact customer support.
- Whenever possible, be specific when assigning data types to each column (for example, if you have data you know is a date, assign it the Date data type). This will give you a better experience when you're working with groupings in your target series. Read Data Types for more information.
Steps
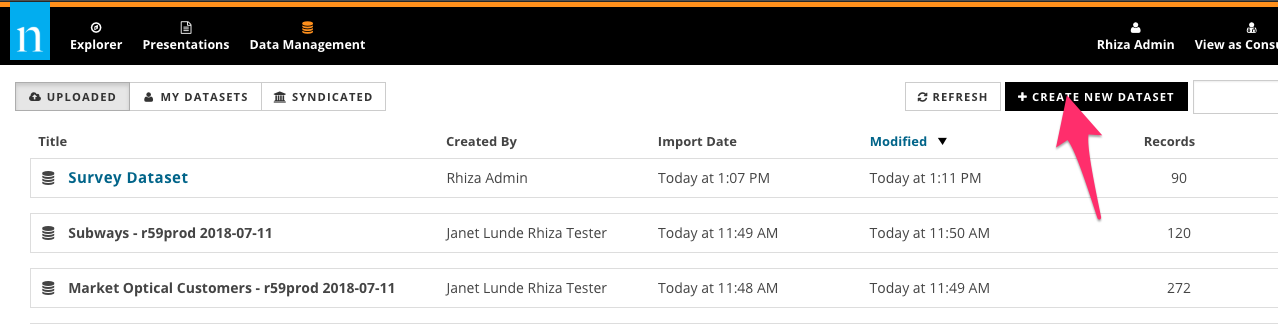
- From the Data Management tab, click Create a New Dataset.
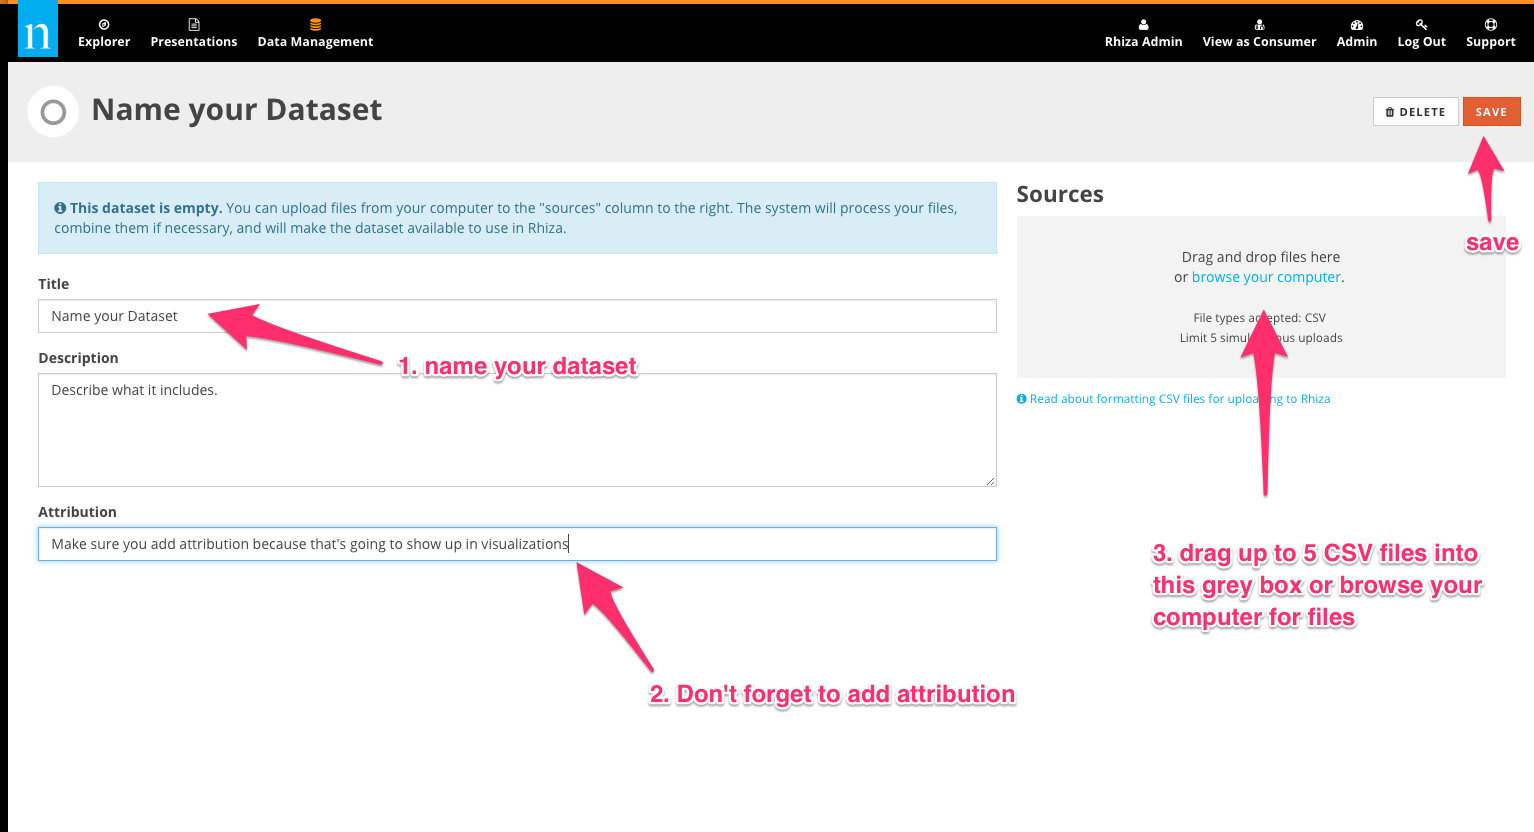
- From the dataset editor, name your dataset, add a description, and provide attribution for your dataset.
- Fill your dataset with data. Drag and drop files from your computer into the grey box on the right hand side (maximum 5 at once) or click the "Browse Your Computer" link. Note, if you intend to upload multiple CSVs and you intend to combine the data, your column titles and data types must be identical across files.
- Set the field types for each column in your dataset. Read Data Types for more information.
- Don't forget to click Save! Now you may use your dataset to build templates and presentations.
Tips
- You can append a file with more columns than your original file. Rhiza will add the new column to the dataset and produce null values for this column in the rows of the original file, thereby allowing you to use many sources simultaneously in the same dataset.
- If you would like for other people to see and use your dataset go back to the Data Management page, find your dataset in the My Datasets tab and click the share button on the right hand side next to the garbage can.
- Giving your dataset a good name, description, and attribution will help other people use your dataset correctly.
Data Types
When you upload your data, you need to assign a type to each column. The system takes its best guess based on the column header and the column content, but you may need or want to change it.
In addition, the choices you make can affect how geographic-based data is represented on a map. See Additional Considerations for Geographic Data to help you decide how to type your data so that it can be shown on a map in the way you want.
As soon as your dataset is uploaded into Rhiza, you're asked to specify the type of data in each column. The system suggests a data type based on what it sees in the first row of the data file, but in many cases, you need to change the default assigned type to make the assignment more specific. Use the guidelines in this topic to help you get the most out of your uploaded data.
Supported Types
Rhiza supports a range of text, numeric, and geographic data types. In some cases, the type you assign determines how the data can be visualized in a presentation:
- Numerical data: If you assign a numeric type (Whole Number, Decimal Number) to a column, it can be used to create calculated values in a presentation. This is important if you want to look at proportion or if you want to create an index.
- Categorical data: If you assign a column as a Text data type, it can be used in target series as either a target filter or a grouping.
- Date: Data that is of type Date can be used in a target series as a filter (represented with the date-picker widget) or as a grouping.
Glossary
Text : Available for all text strings. Although you can use this option for information that doesn't adhere to a specific data type, we recommend using a more precise type when possible. For example, if you have data about ethnicity or education level, consider assigning the Text data type to it.
Date : Available for date data formatted as MM-DD-YYYY. Dates are useful for filtering your report data and telling a time-based story. For more information, see Tips For Uploading Data With Time Attributes.
Date Time : Available for data that contains both a date and a time (for example, 2015-03-27 18:26). If your column contains time information, you must use this data type. For more information, see Tips For Uploading Data With Time Attributes.
Whole Number : Available for whole numbers. This is useful for whole numerical values that don't adhere to a specific data type (for example, a count like "people who own blenders"). Numeric fields are aggregated by reports.
Decimal Number : Available for numerical data that contains a decimal point. Use this type when you have fractions or when your have exceptionally large numbers (for example, 2 billion). Numeric fields are aggregated in presentations.
Percent : Available for data formatted as a percent, not a decimal. It does not matter if you include the percent symbol (for example, 25% can be 25 or 25% but not 0.25 in your uploaded data file).
Latitude : Available for data formatted as a decimal (for example, 35.929673). Use this option with the Longitude option to specify exact map coordinates.
Longitude : Available for data formatted as a decimal (for example, -78.948237). Use this option with the Latitude option to specify exact map coordinates.
Street Address : Available for text strings; indicates the value is a street address. Although there are no restrictions on the values, note that values such as "2nd floor" or "Apartment #3" can lead to less accurate mapping.
City : Available for text strings; indicates the value is a city.
County : Available for text strings; indicates the value is a county.
State : Available for text strings; indicates the value is a state. You can use full state names or abbreviations.
ZIP Code : Available for data formatted as a 5-digit ZIP Code.
DMA : Available for data formatted as a Designated Market Area (DMA) code (for example, 504). This is sometimes also referred to as Nielsen Markets.
The system only shows eligible data types in the drop-down menu. If you can't set the data type you want, check your file for missing or incorrectly formatted data. This sometimes happens with ZIP Codes - if your data file has missing values in the ZIP Code column, or if a ZIP Code has been mistyped or truncated (for example, changed from 00501 to 501 as some spreadsheets do), the ZIP Code type will not appear as an option.
If you do not assign a data type to a column, it defaults to Text.
Public vs. Private Data
Any dataset that you upload can remain private (meaning only you can use it) or can be shared with all others in your organization. Keep in mind the following points about shared datasets:
- Even though others can use the dataset in their presentations, nobody else can download or modify the actual dataset. Once you upload it, the data is fixed and cannot be changed.
- If someone in your organization decides to use your dataset in a presentation, the data is attributed to you. (This is just another reason to make sure that your user name—also your display name—is professional and recognizable.)
- You cannot explicitly share your dataset with one or more users, and not others. Much like Presentations and Templates, datasets are shared with the entire group.