To share or present your findings with others, you can create a Microsoft PowerPoint version of your presentation in just a few easy steps. Every part of your presentation -- from labels to individual geographic shapes -- is editable within the generated PowerPoint, although you might need to use the ungrouping options in PowerPoint to access certain aspects of the visualization. Graphics are exported as vector files, which means that they can be resized without losing quality, and can be edited in third-party products.
Before You Begin
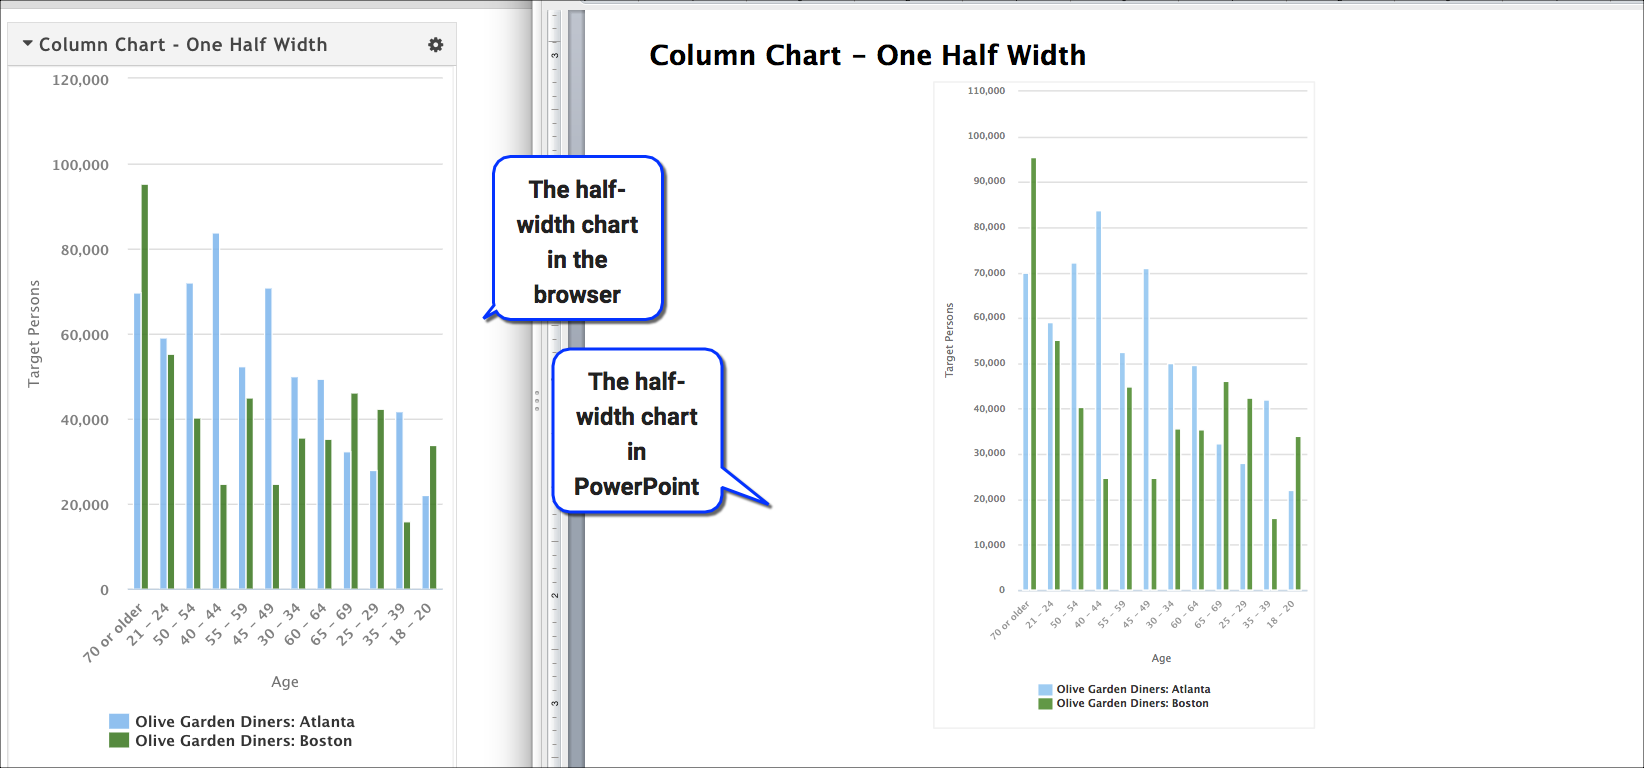
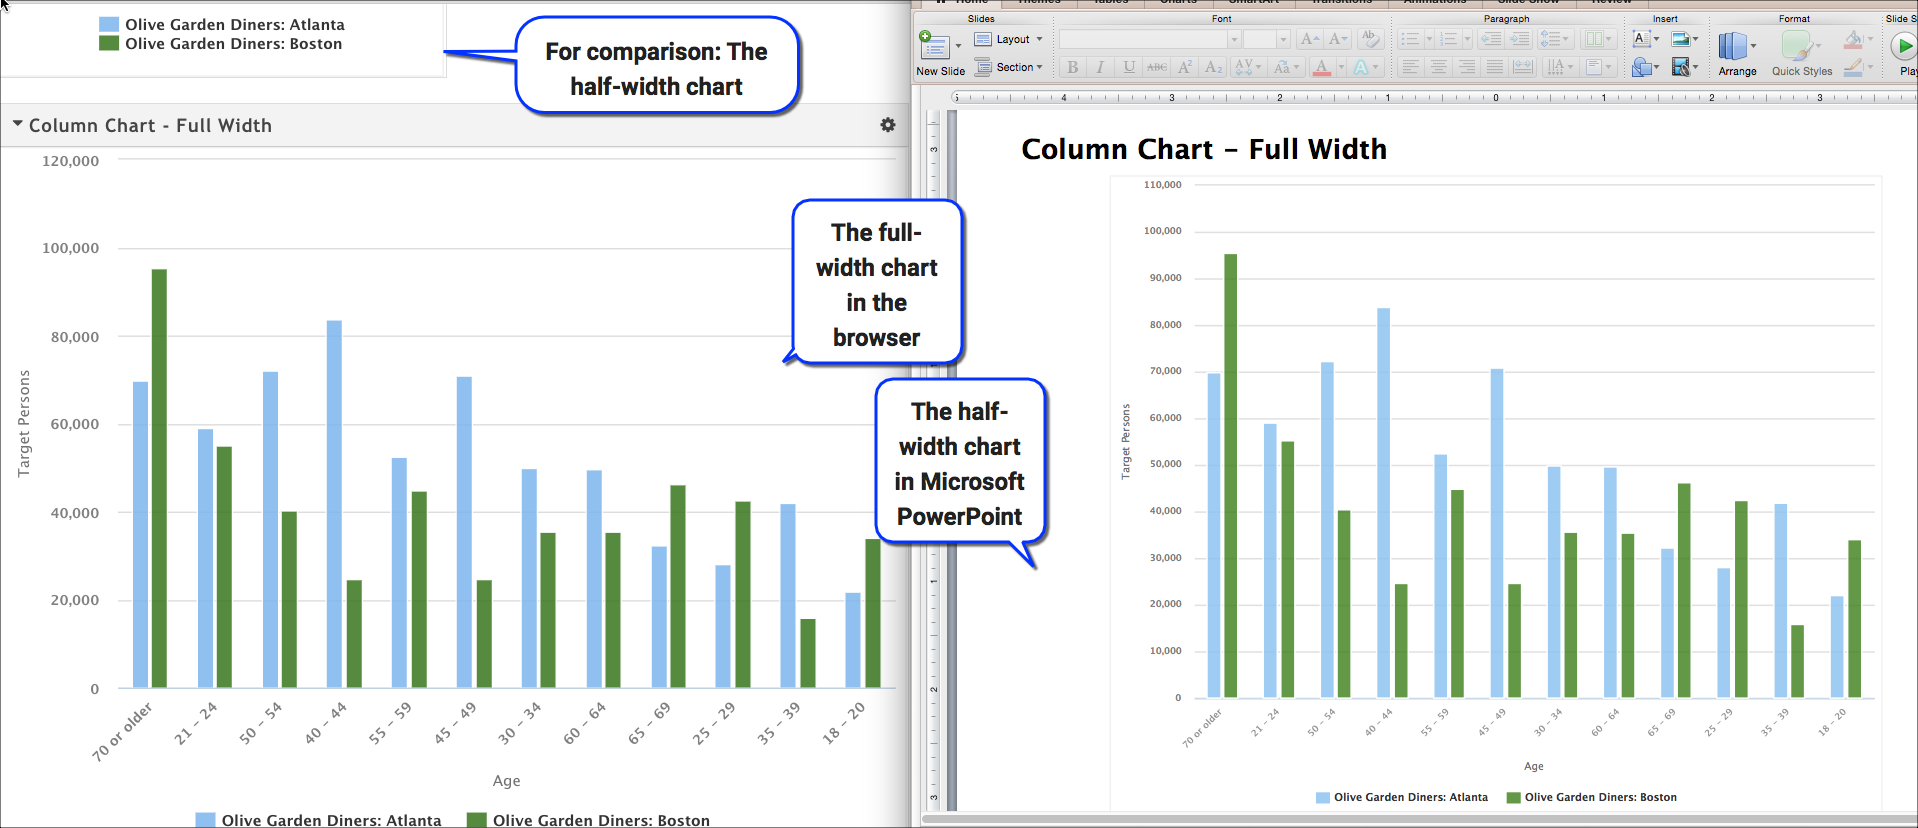
Make sure that your visualizations are in the order and the width that you want them. will place one visualization per slide, in the order they are found in the presentation. The visualization will be scaled to fill the slide, though the visualization width does make a difference. Remember that visualizations can have one of four widths:
- Full size
- Two thirds
- Half
- One third
To show you the difference visualization width makes in PowerPoint output, consider the following graphics.
Steps
Open your presentation.
Click Generate PowerPoint.
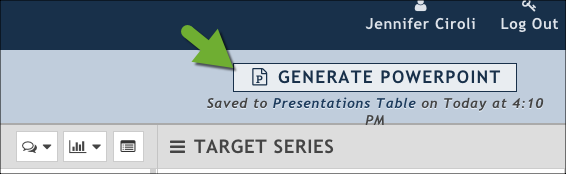
Once the PowerPoint generation is finished, this button changes to Download PowerPoint.
Click Download PowerPoint.
Optionally, open the PowerPoint version of the presentation and make any changes you need.
If you make changes to your presentation after you've generated the PowerPoint, the Generate PowerPoint button becomes available to you so you can update your PowerPoint.
Once you create a PowerPoint, you can download it from within the presentation itself or from the Presentations tab.