Tables are a straightforward way to display your data, particularly when you have many results that might otherwise crowd a more visually oriented approach (a column or line chart, for example).
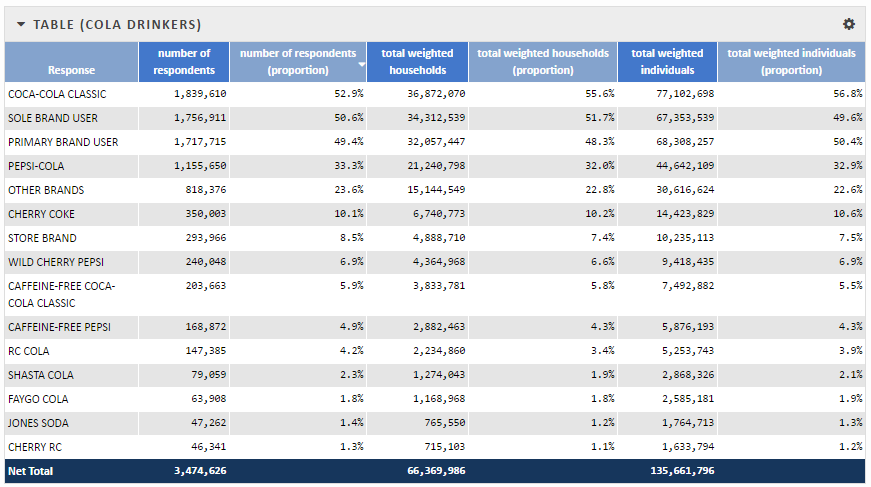
A table visualization
By default, a table shows all of the columns associated with a single data series. You can configure the table to show only the columns you are interested in, to show only a certain number of rows, or to add an optional Net Total row.
Sorting results
When you sort data in the table by clicking on a column header, it sorts all of the series results, not just the items that are shown in the table. You can combine sorting with the Items to Show configuration option to create a table of the top results.Exporting results
You can download the data in a table as a comma-separated value file (CSV) for use in a spreadsheet or database application. Click the gear menu at the top right of the visualization and click Download CSV from the menu. The exported file contains all of the data available for the data series, regardless of how many rows you've configured your table to show.
For information on how to customize the table visualization, see Configuring a Table Visualization.