To tell a compelling sales story, you often want to show the trade area for a business and how it overlaps with the audience for a radio or television station. With , you can easily show a station's audience, the business's location, and the custom-defined trade area to demonstrate how the station reaches the business's target customers. You can also dig into the data to find insights that will make your sales story pop. Learn more about people in the trade area:
- What are the primary reasons they use a car dealership?
- What's their income level?
- What restaurants do they eat at most often?
- Where do they buy home furnishings?
- Do they plan to do a major home renovation over the next year?
- Which political party do they belong to?
The questions you ask are limited only by the Scarborough survey conducted in your market -- there's a wealth of information at your fingertips.
These steps show you how to create a target series that places a radius around points on a map. There are two methods for creating a radius around a point:
- Enter an address: Use this method if you know the exact business address and want to quickly create a radius around it, or if you don't already have an existing target series that plots the business on the map. (See Known Limitation section below.)
- Link to an existing series that plots a point or points on a map: Use this method if you have one or more existing target series that plot a point or points on the map, such as an AggData target series that plots business locations or a Polk target series that plots a dealer's location.
Create a new target series.
Specify the dataset you want to use.
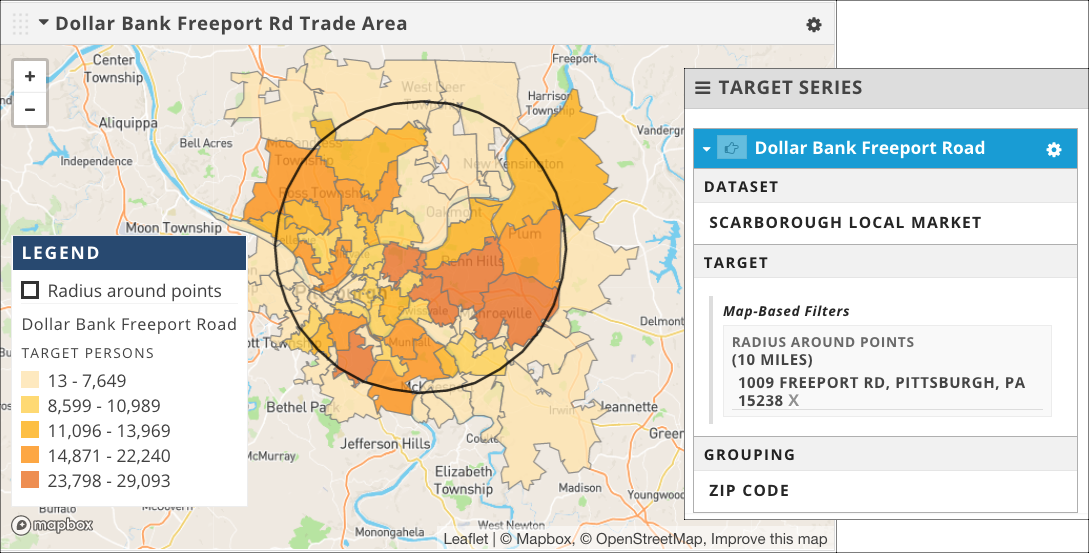
In the Target Filters page, click the Map-Based tab.
Expand the Radius around points attribute.
Enter your trade area in the Distance field. This value determines the width of the circle on the map.
To create a radius by entering one or more addresses, perform the following steps:
From the Point Source drop-down, select Manual List of Addresses.
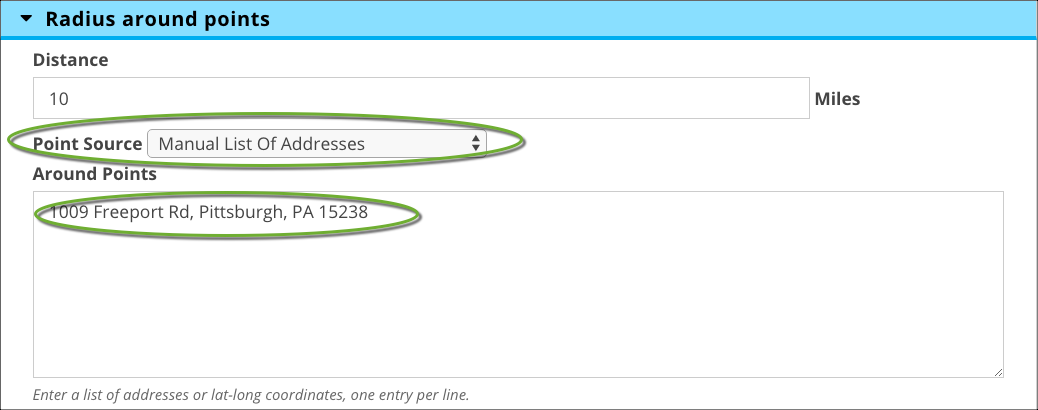
In the Around Points box, type your address or list of addresses. If you have more than one address, each must be on its own line.
To create a radius by linking to one or more existing target series, perform the following steps:
From the Point Source drop-down, select Points From Another Series' Grouping.
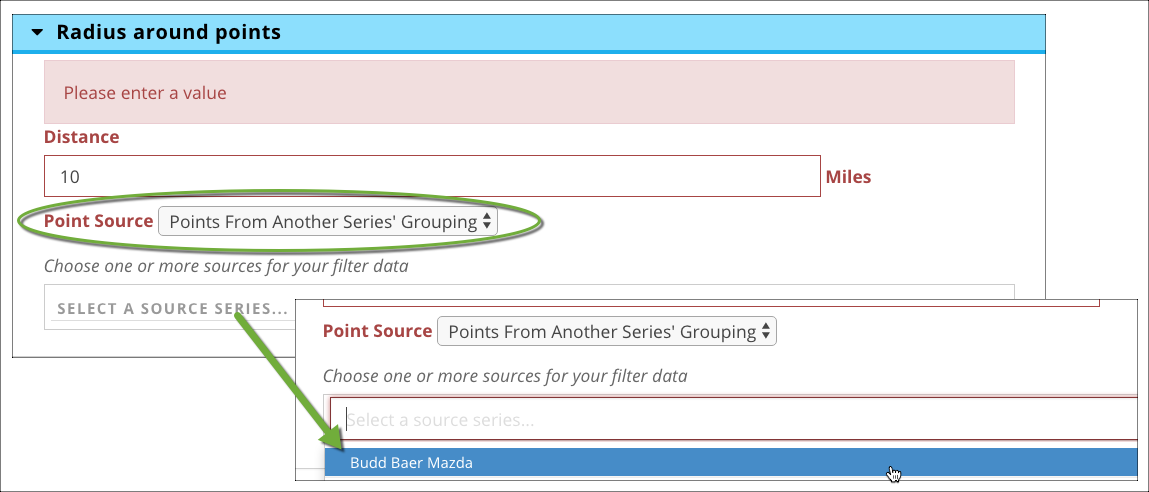
In the Select a Source Series drop-down, select the target series that plots the point or points on the map. The available series are those that group to a point on a map (for example, a Polk series that groups to the Dealer attribute, or a Scarborough or AggData series that groups to the Records attribute).
On the Select Grouping tab, select a map-based attribute such as ZIP Code.
Name and save your target series.
Update your presentation.
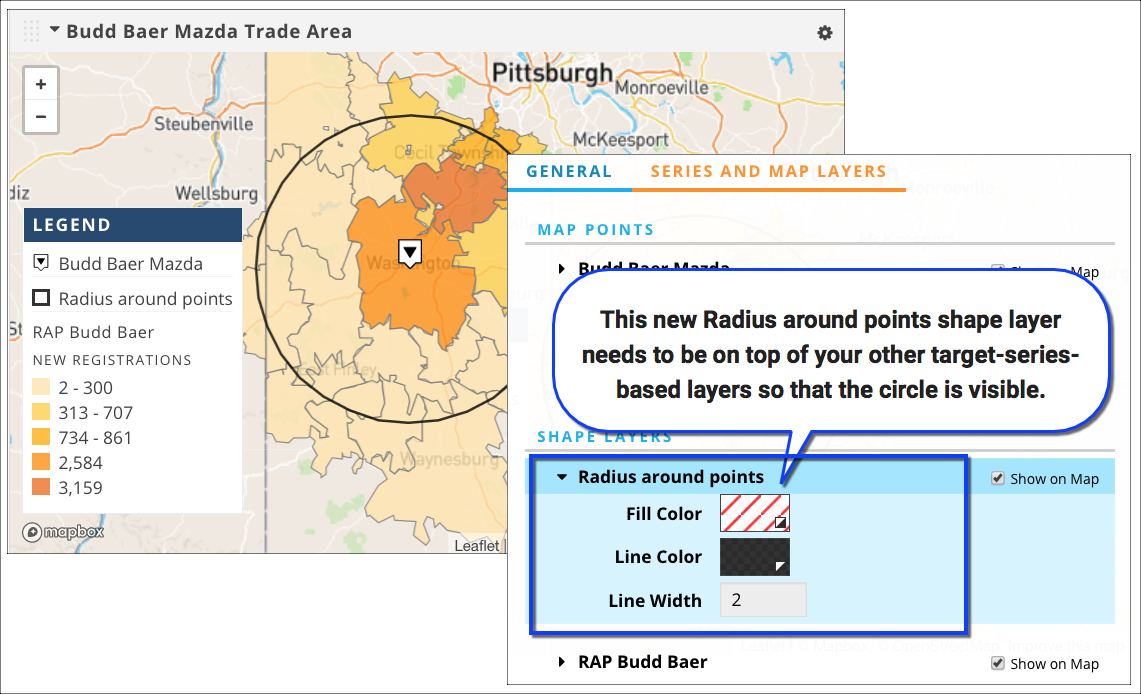
Add a map visualization to see your trade radius. The radius itself becomes a new shape layer (a context geography), along with the new target series you created. In order to see the radius on the map, the Radius around points shape layer must be the top layer on your map.
The data returned is for the area inside the radius or radii only. In other words, if a ZIP Code is partially inside a radius, only the data for slice of the ZIP Code inside the radius is returned.
Known limitation
There is a known limitation with the radius around points functionality for this release when working with the Scarborough Local Market dataset. If you opt to create a radius by manually entering an address in the Radius Around Points attribute, you will get a radius around the address, but no visible point marker: