This topic shows you how to implement a simple linked series by creating a source series and a receiving series and linking the two. The steps use the Scarborough Local Market dataset and some example filters; substitute whichever dataset and filters you need for your series.
Before You Begin
Make sure you've read the overview and understand the basic concepts in these topics:
Steps
In this set of steps, we're going to create a source series that returns a list of ZIP Codes where TV station viewers live. We're then going to create a receiving series that uses that list of ZIP Codes as a target filter and asks: "Which credit cards do people in this list of ZIP Codes use?"
Create your source target series. (If you need help with specifics, refer to Add Data To your presentation.)
Click Create New Target Series to open the Create Target Series Wizard.
Specify the Scarborough Local Market dataset. The wizard moves you to the Select a Target page.
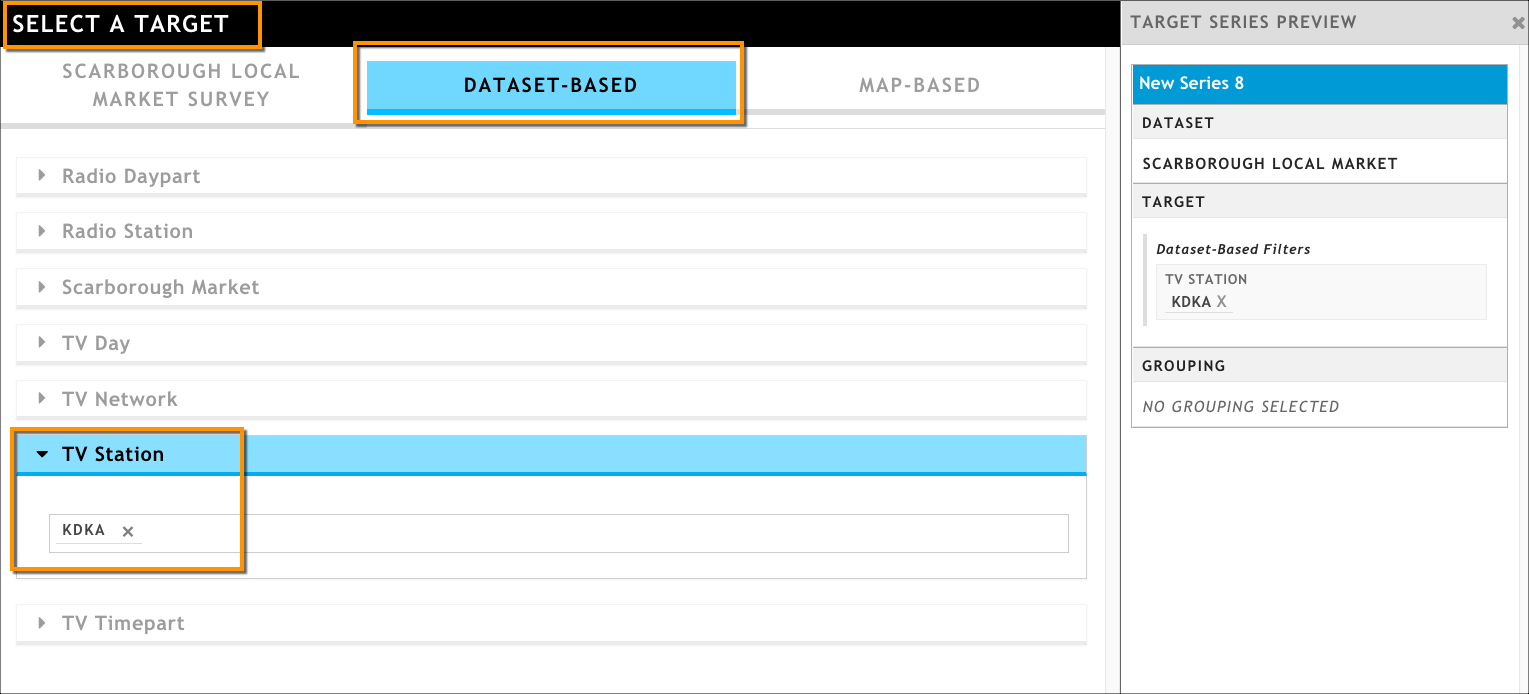
On the Dataset-based tab, enter a TV station in the TV Station attribute field.
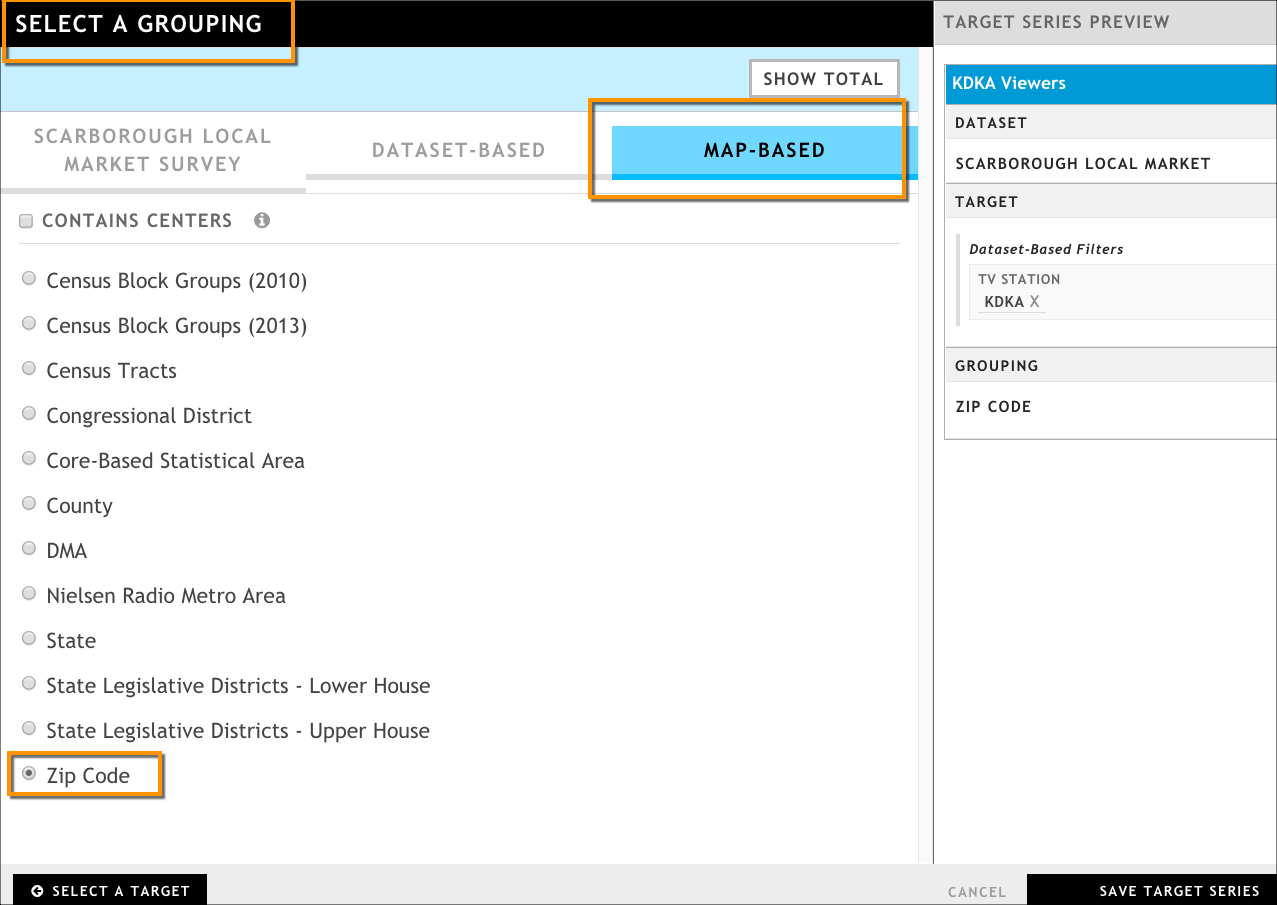
Click Select a Grouping.
On the Select a Grouping page, click the Map-Based tab, then click ZIP Codes.
Rename your target series to something like Station Viewers.
Click Save Target Series.
Create your receiving target series, linking it with the source series.
Click Create New Target Series to open the Create Target Series Wizard.
Specify the Scarborough Local Market dataset. The wizard moves you to the Select a Target page.
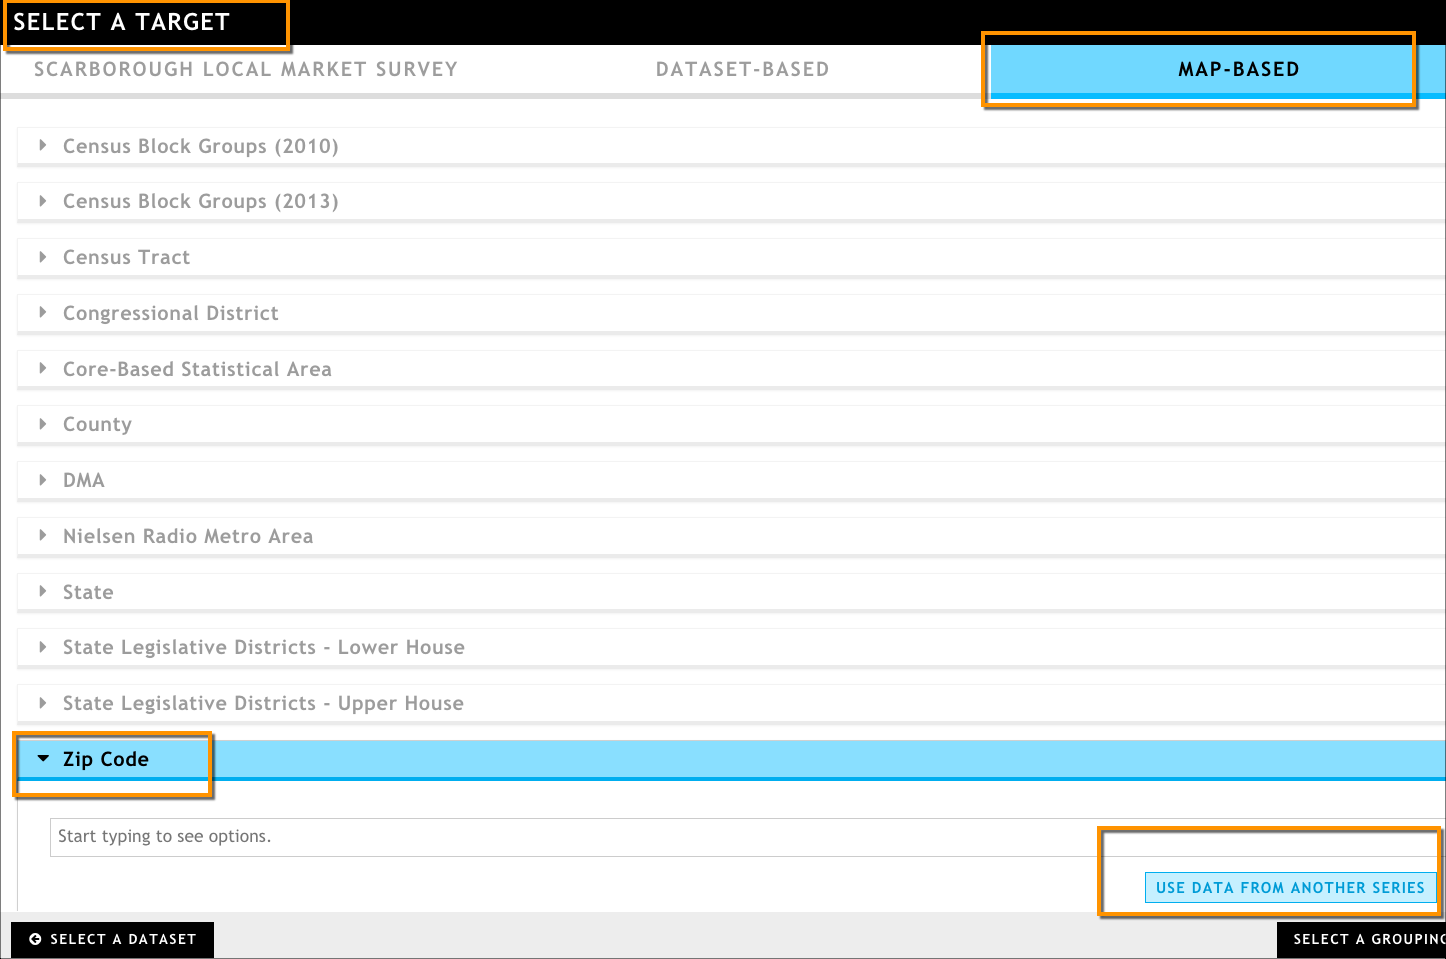
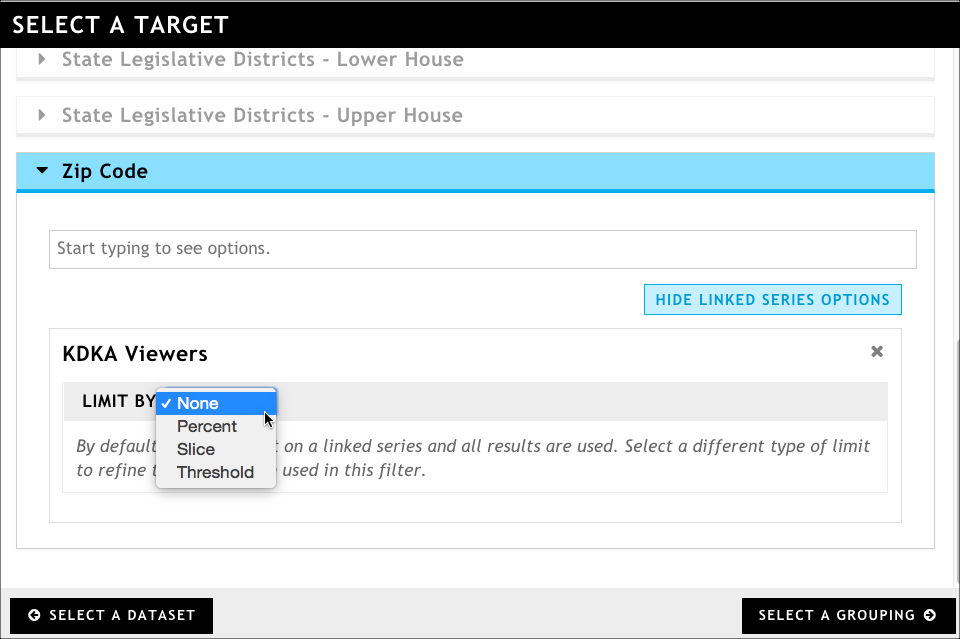
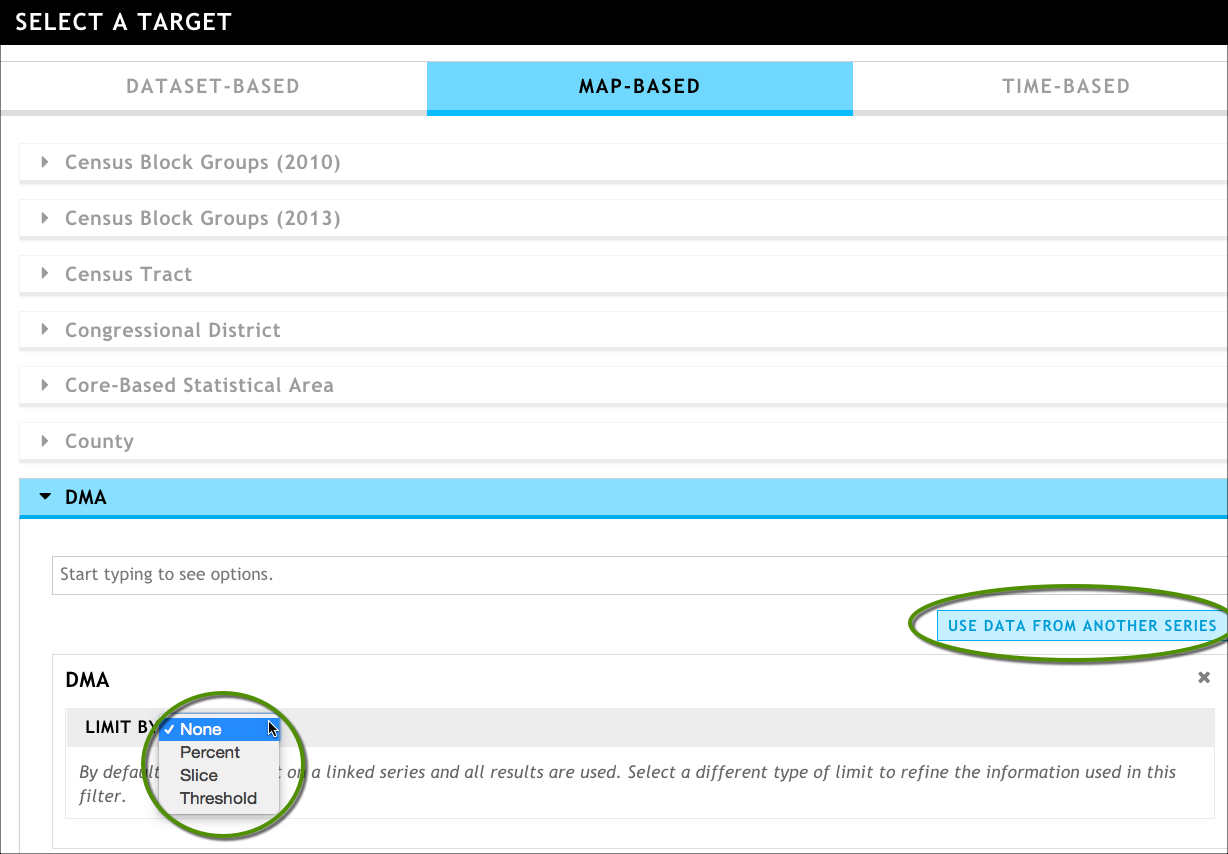
On the Map-Based tab, we're going to link to our source series. Remember: linking is based on the grouping used in the source series, so in the ZIP Code attribute, click Use Data From Another Series.
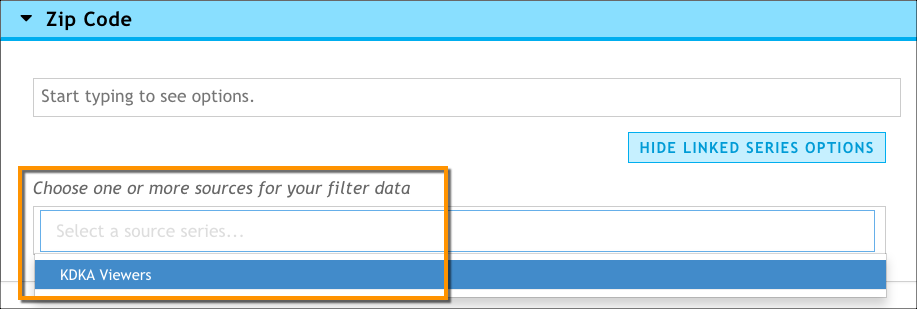
Select the source series you want to use. In this case, we want to use the results from the target source series we set up in Step 1; it will be a list of ZIP Codes where a TV station's watchers live.
Optionally, select a limit if you want to see only a portion of the results passed down from the source series. For more about limits, see Overview of Linked Series Concepts.
Click Select a Grouping.
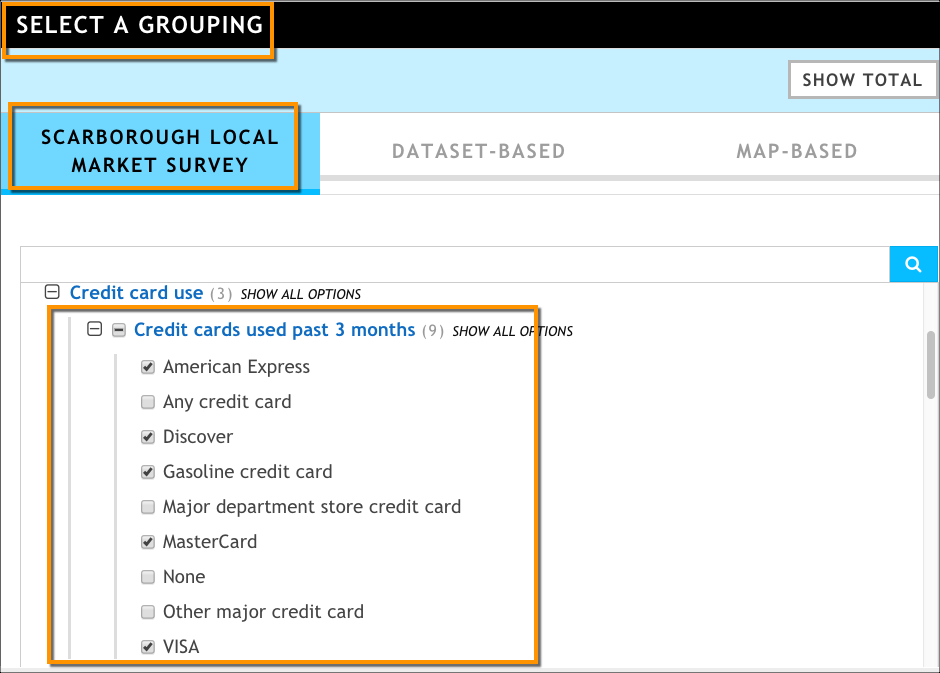
From the Select a Grouping page, group to the following set of Scarborough Local Market survey responses. This will allow us to get a list of credit cards used by those living in the ZIP Codes we obtained from the source series.
In the Preview Target Series pane, rename your receiving target series.
Click Save Target Series.
Click Update Presentation.
Add any visualizations you want. See Adding and Configuring Visualizations.
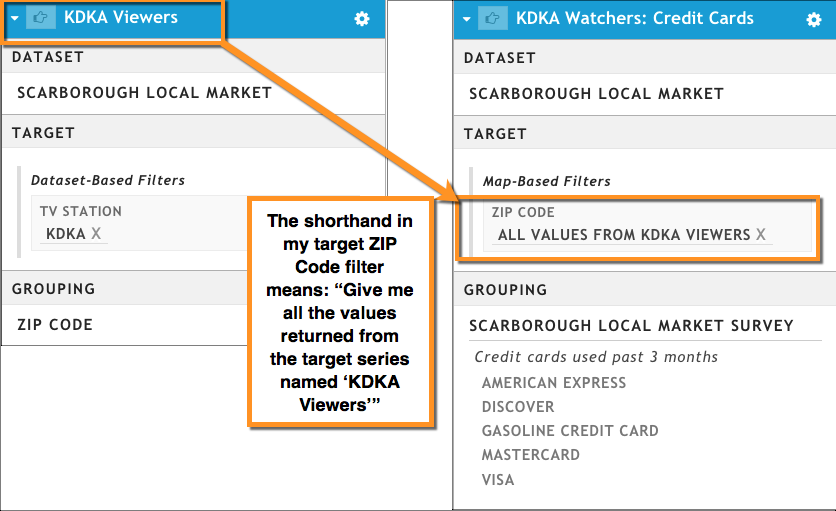
If you look at your two target series. you can see that the second is receiving data from the first.
Linked Series concepts
Linked series can be used alongside regular (non-linked) target series to create a powerful presentation that, when templated, hides the complexity from the user.
They also allow you to create a repeatable target that can be defined in one series but linked to (or inherited by) every other target series in the presentation; this can be a huge time saver for presentation creators, and it also limits the number of times the template user needs to input a value for that target's filter.
Types of Target Series
There are a few distinct types of target series when using the linked series feature
Regular target series: A target series that isn't linked to any other series. It stands alone and is not affected by any changes to other series.
Source target series: A target series that provides filter data to one or more receiving target series. Once a target series becomes a data source for other target series, you can no longer edit the grouping or delete the series as long as it's linked to receiving series. Once any links have been removed, those restrictions are removed.
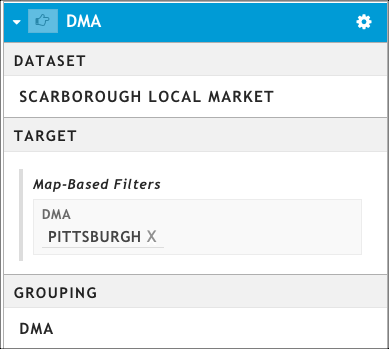
Pass-through series: A type of source series that has the same target filter and grouping and that is passed through multiple receiving series. An example might be a series called DMA; because it's used in almost every other series in the presentation, it's a very simple and focused series:
Receiving target series: A target series that receives filter data from the source target series; it is considered linked to the source.
- The data is received by specifying the source series as a target filter.
- A receiving series can also be a source series; if it is a source series, you cannot edit the grouping or delete the series until any links to it are removed.
What can I link?
Linking is based on grouping; you pass the result of a source series (driven by the grouping you pick) to one or more receiving series. Therefore, you can link anything you want between a source series and a receiving series, as long as results (the grouping) in your source series match a target filter in your receiving series.
You can also have multiple links in a receiving series. For example, if you have a source series that defines a DMA and a source series that defines a dealer, you can link to both of those in a receiving series.
What is passed between a source and a receiving series?
Only the results (based on the grouping) of the source series are passed to the receiving series. The target filters that provide context for the results are not passed.
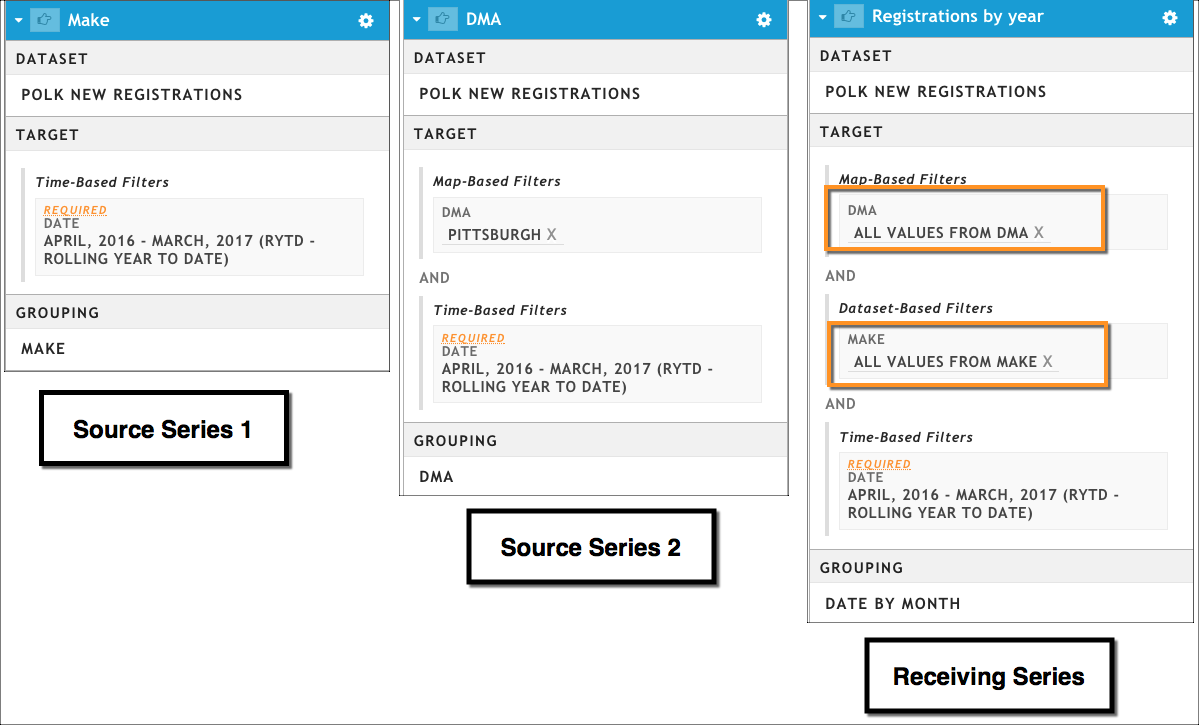
For example, I have a source target series that finds all new Ford registrations in the Pittsburgh DMA, and then groups those results by ZIP Codes.
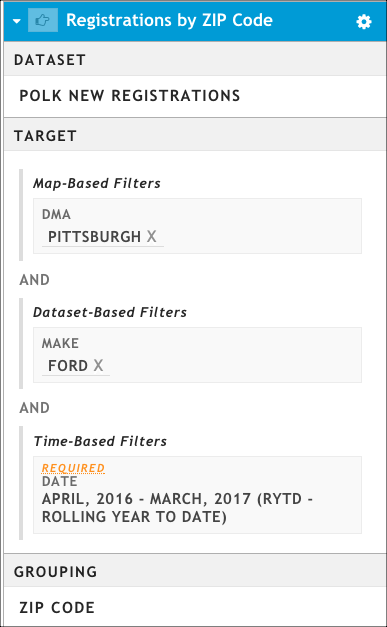
A source series that finds all Ford registrations in a DMA and groups by ZIP Code
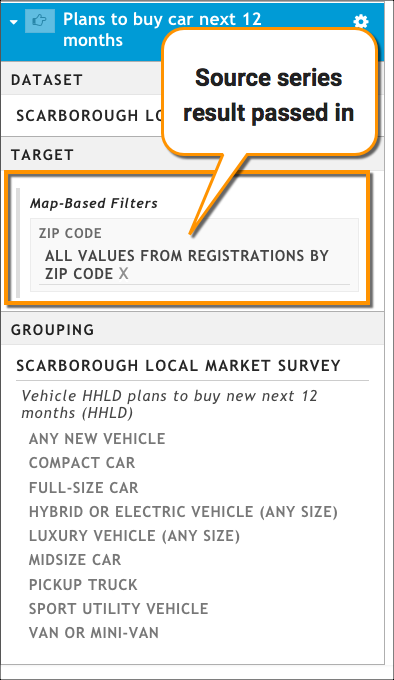
This series returns a list of ZIP Codes in the Pittsburgh DMA where new Fords were registered. If I pass this source series into another series, all that is passed is the list of ZIP Codes. The Make and DMA target filters are not passed to the receiving series. This might be fine if we wanted to create a target series that uses this specific set of ZIP Codes and then examines some consumer behavior or demographics within them.
In this example, we don't need to add the Make and DMA filters from the original source series since we're examining something other than Ford dealers in a DMA.
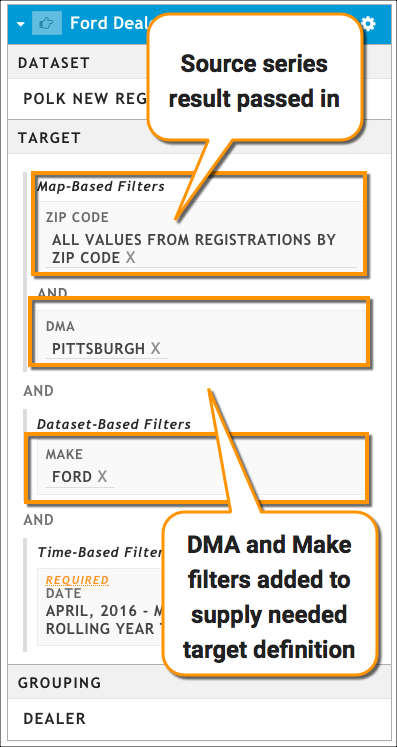
However, if I wanted to use this list of ZIP Codes in my receiving series to find all of the Ford dealers in the Pittsburgh DMA, I need to manually add those Make and DMA filters to my receiving series. Otherwise, I would simply get a list of all dealers who registered any kind of car in those ZIP Codes.
What happens if I make changes to my source series?
If your series are linked and you change a target filter in the source, the changes cascade down the chain of linked series. The user interface will indicate which target series are affected by the change and you will be asked to update the presentation to capture the changes in your visualizations.
What are limits?
Limits help you refine the data you pull in as a link. In some cases, you might want to use the full set of results from the source series (for example, a list of car models or a set of ZIP Codes). In other cases, the full set of results is too large to generate meaningful results when used in a receiving series. For example, a list of all dealers in a DMA might be hundreds of rows long, and I might not care about every dealer on that list.
A limit lets you get to the specific part of the result set that you want to reuse in your receiving series. It is set on the receiving series, when you specify that you want to use a source series to provide the data for a filter.
Slice
Slice lets you see the top N or bottom N rows (where N is the number of rows you want to see). When appropriate, the results can be sorted by attribute. A few tips:
- If you're trying to add a limit and see that the ordering attribute field is empty, remove the limit, finish creating your receiving series, and refresh the presentation.
- If this receiving series is being indexed against a context series, additional sort values are available in the ordering attribute field. You can use these to find the top or bottom indexing responses.
Example: My source series finds all of the Ford dealers in the Pittsburgh DMA, but I only want to see the top 3. When I link to my source series, I can set a Slice limit to Top 3.
Percent
Percent lets you see the top or bottom percentage of rows. When appropriate, the results can be sorted by attribute. A few tips:
- If you're trying to add a limit and see that the ordering attribute field is empty, remove the limit, finish creating your receiving series, and refresh the presentation.
- If this receiving series is being indexed against a context series, additional sort values are available in the ordering attribute field. You can use these to find the top or bottom indexing responses.
Example: My source series finds all of the ZIP Codes a dealer has registered cars in. In my receiving series, I want to find only the ZIP Codes that account for the bottom 30% of the dealer's registrations to identify potential problems and brainstorm areas for improvement.
Threshold
Threshold sets a value and then returns results either above or below that value. A few tips:
- If you're trying to add a limit and see that the ordering attribute field is empty, remove the limit, finish creating your receiving series, and refresh the presentation.
- If this receiving series is being indexed against a context series, additional sort values are available in the ordering attribute field. You can use these to find the top or bottom indexing responses.
Example: I have a source series that groups to a set of Scarborough Local Market survey responses. I want to use only responses with more than 70 respondents to eliminate statistically unreliable data.