When you create a presentation from a Report, you create at least one target series to define the target you want to know about (for example, female residents of Pittsburgh between the ages of 18 and 45, or a particular car dealership). If you need a refresher on how target series work, you can read Target series.
In this set of topics, we'll delve into creating the target portion of the target series specifically. If you are using linked series, be sure to read Creating Linked Target Series.
Before You Begin
Make sure you've created a new presentation and started creating a new target series. You should have already specified which dataset you are using. See Add Data to Your Presentation.
Steps
Make sure the Create Target Series wizard is open to the Select a Target tab.
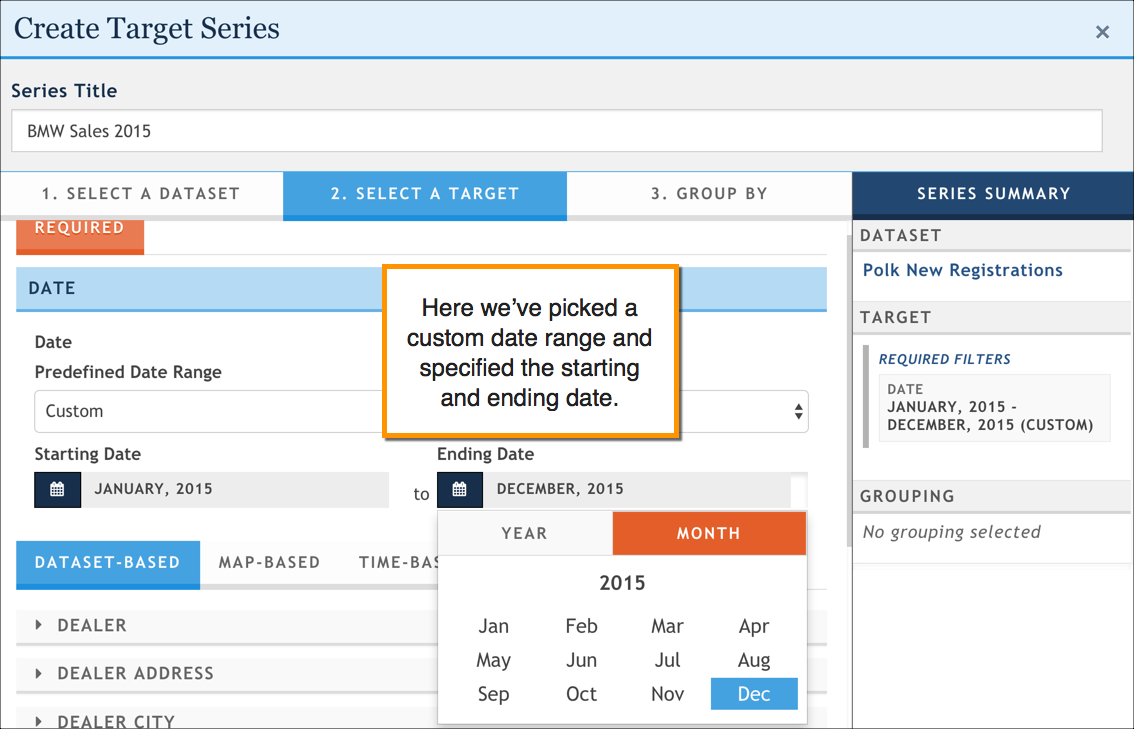
If your dataset requires a date range (for example, IHS Polk), use the Date filter to specify the time period you want to include.
Add the first filter you want to use to define your target. Depending on the dataset you choose, you might see multiple sub-tabs here:
- Dataset-based or Survey-based: These are the attributes that are included in the dataset itself (for example, in the Polk New Registration dataset, you'll see attributes like Dealer, Make, Model; in Scarborough USA+, you'll see attributes like Level Of Education Summaries, Credit Cards Used Past 3 Months, etc.).
- Map-Based: If your dataset has geographic data associated with it, this tab appears and you'll see attributes like State, Zip Code, DMA, and others.
- Time-based: If your dataset has temporal data, this tab appears and you'll see attributes like Date By Month, Date By Year, and others.
Add one or more values for the target filter.
Remember: the system uses an OR operation between multiple values for an attribute. For example, if you selected the attribute Gender and then specified Male, Female, and Unreported, the system searches the dataset for any of those three attribute values. For more information on searching survey-style datasets, see Search and browse survey-style datasets.
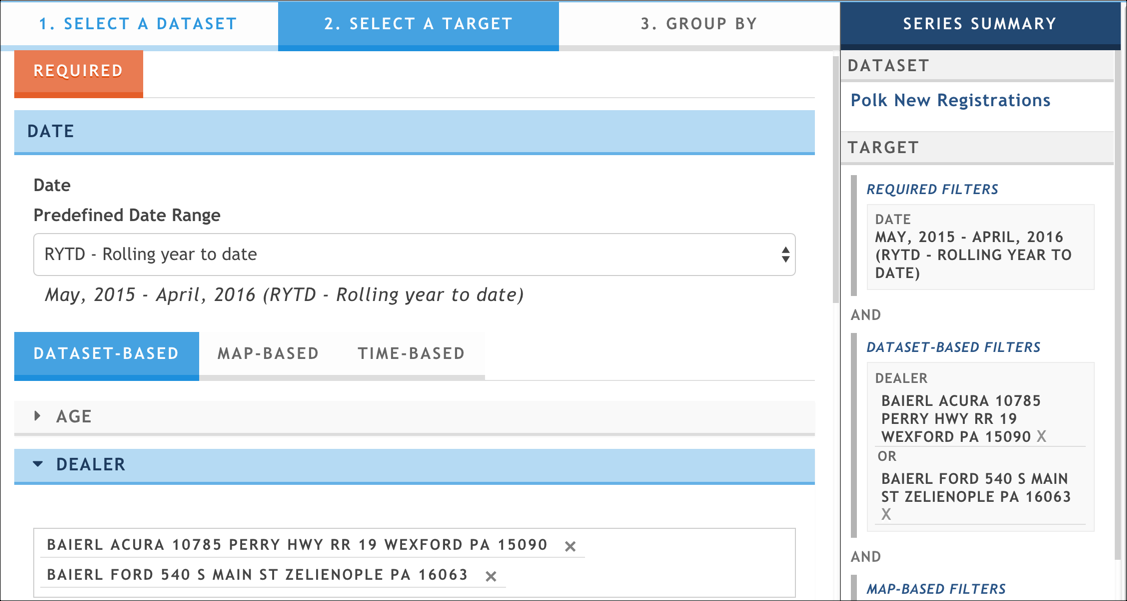
An example of setting multiple values in a dataset like IHS Polk; here we specified multiple dealers. Notice the OR Booleran operation between these two values. (click to enlarge)
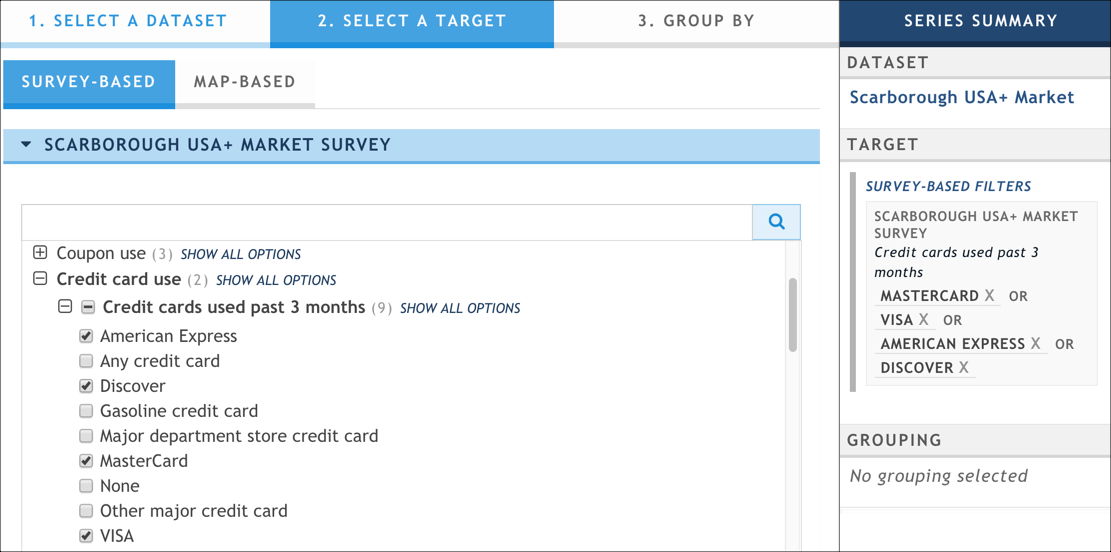
An example of setting multiple values in a dataset like Scarborough USA+; here we specified multiple answers to a survey question. Notice the OR Booleran operation between these values. (click to enlarge)
If you wish to clear the target values for an individual attribute, select the "Clear Filter" button in the upper-right near the filter input.
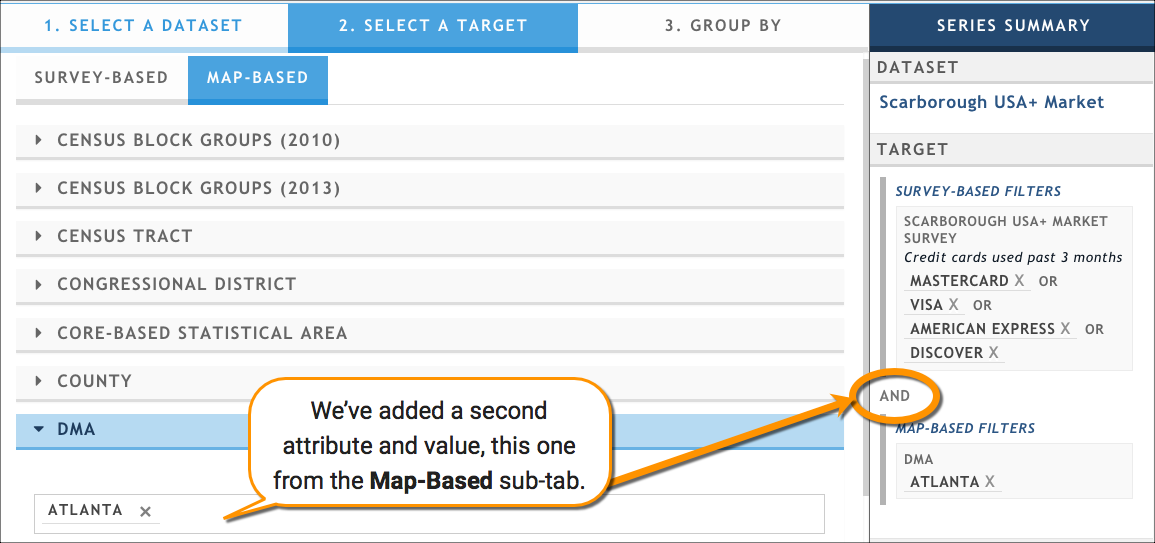
Add additional filters and values until your series filters the data according to what you want to see. You can add filters from one or more tabs to the same data series. The system uses an AND operation between different filters.
In this example, we've added a second attribute and value from a different sub-tab; notice the AND Boolean operation.
Preview your target by using the Series Summary pane in the wizard. You can make any updates either in the summary pane or in the Select a Target tab.
If you are creating a new target series, click Next to advance to the Group By Tab, and read Group (or aggregate) your data.
If you are simply updating the target for an existing target series, click Save Series to close the Create Target Series wizard.