To use an index, you'll need to create one or more taraget series with the attributes you want to examine, as well as a target series that you want to use as the index (this will be the context series). You'll also need to configure your visualization to show the index correctly.
In this set of steps, we're going to create an index by using a regular target series, a context target series, and a column chart that we configure.
Steps
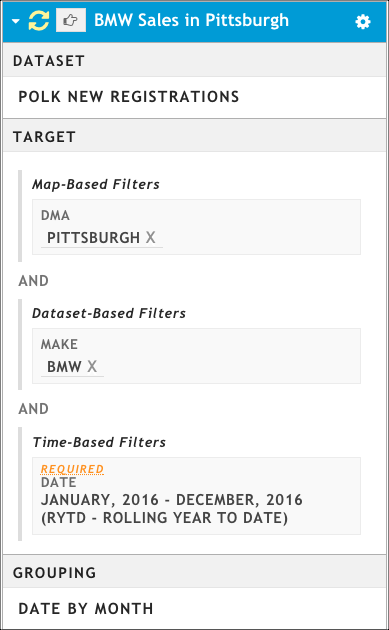
Create a new target series that defines a target you want to look at. For example, you might want to look at BMW sales in your DMA, grouped according to month.
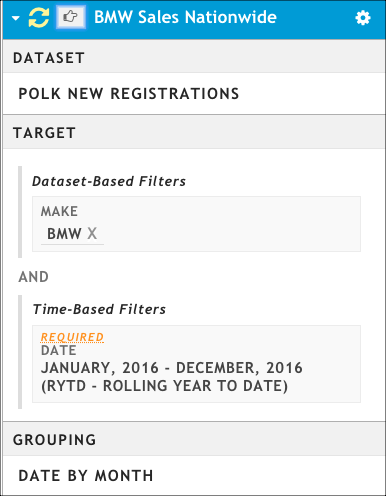
Create a second target series that will serve as the context series. When defining this series, remember these points:
- You must use the same grouping value that you used in your first target series.
- The context series measures something bigger than the original target series. If, for example, your first target series contained a DMA, the context series should remove the DMA and examine a larger area (perhaps the state, or even nationwide).
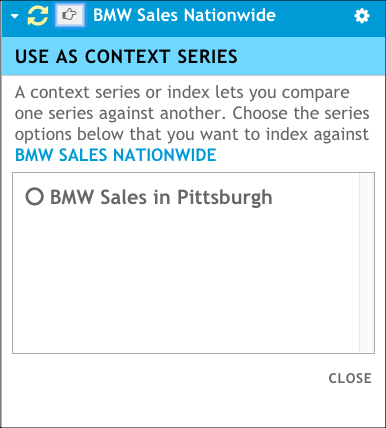
Click the pointer icon next to the second series name to change it to a context series.

The Use as Context Series dialog box opens and lists all of the target series that can be indexed against this context series. Only target series that share the same grouping with the context series can be indexed against it.
In the Use as Context Series dialog box, pick the first series you created, and then click Close.
Click Update Presentation.
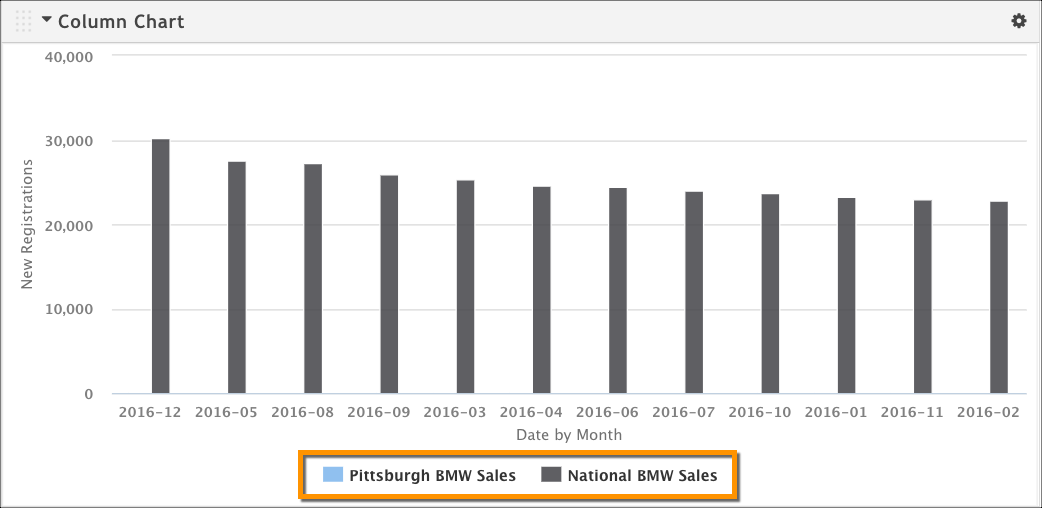
Click Add Viz > Column Chart. By default, the column chart displays both the target series and the context series, which isn't what we want to show. We want the context series to be represented as an index line.
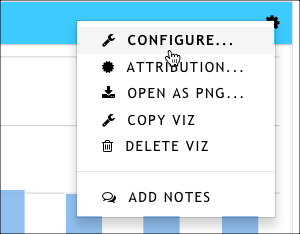
Click the gear drop-down menu from the top right of the chart, and then click Configure to open the configuration dialog box.
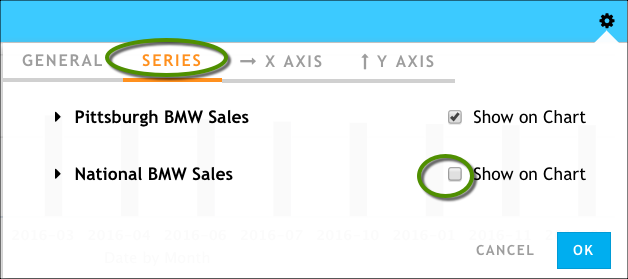
On the Series tab, clear the context series. You do not want it to display on the chart.
On the Y AXIS tab, make the following changes to enable the index line to display:
- Change the value of Data to Display to the index calculation (in this example, it's New Registrations (index)).
- Enable the Index Decoration > Show Index Line option.
- Set values for the Line Color and Line Width options.
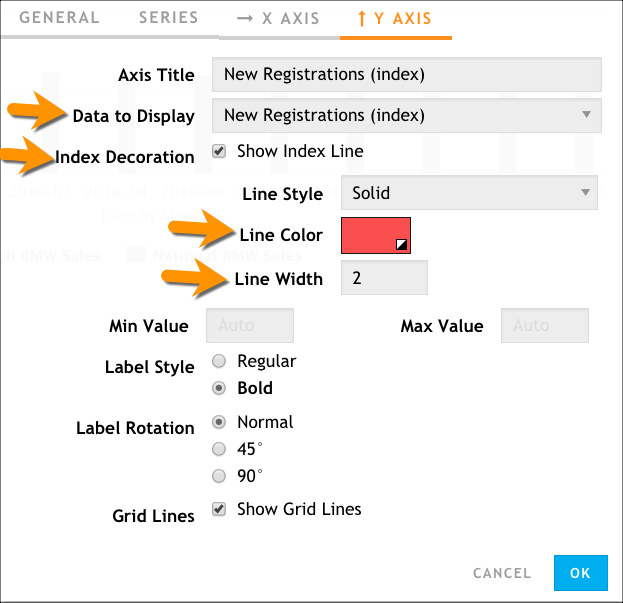
Click OK.
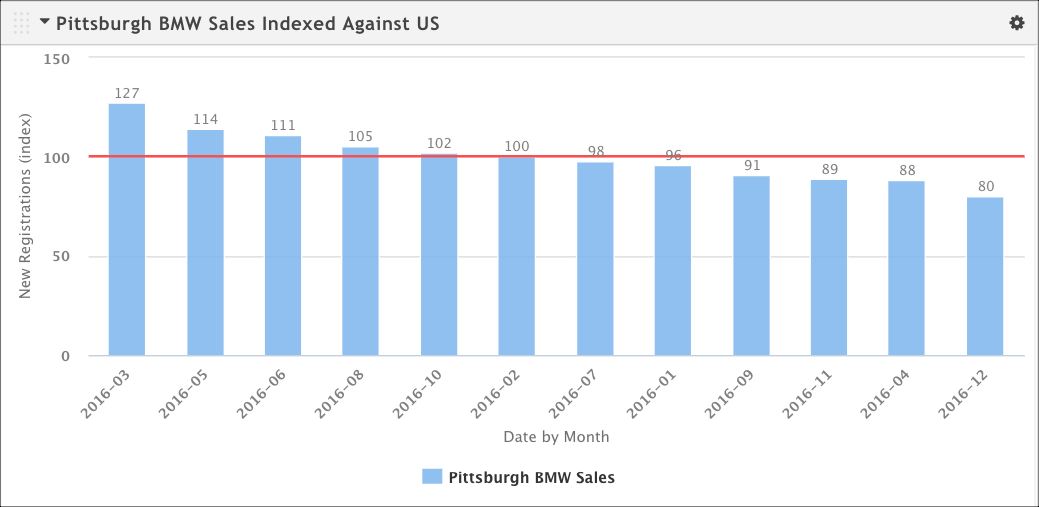
As we can see in the resulting chart, in certain months Pittsburgh BMW sales over index compared to the national average. Unfortunately, though, it looks like December of 2016 was a rough month for Pittsburgh BMW dealers when looking at them against all BMW dealers.
To assist you, here's a video tutorial demonstrating how to accomplish this. Video: Create an index with a context series
Example: Market Share
Let's walk through an example of calculating market share for a local Subaru dealer (Day Subaru) by using a context data series.
The first thing we need to do is create three target series using an auto sales dataset like IHS Polk New Registrations.
- Target series 1: National Subaru Sales -- All new Subaru registrations nationwide during a set period
- Target series 2: Pittsburgh Subaru Sales -- All new Subaru registrations in Pittsburgh during the same period
- Target series 3: Day Subaru Sales -- All new Subaru registrations for the specific Subaru dealer in Pittsburgh during the same time period
First, we want to look at how Day Subaru and the Pittsburgh market are doing compared to national Subaru sales. This means that we mark National Subaru sales as the context series and configure it to be an index on the Y axis and to be shown as a line on our column chart rather than a column. We're grouping on models of Subarus.
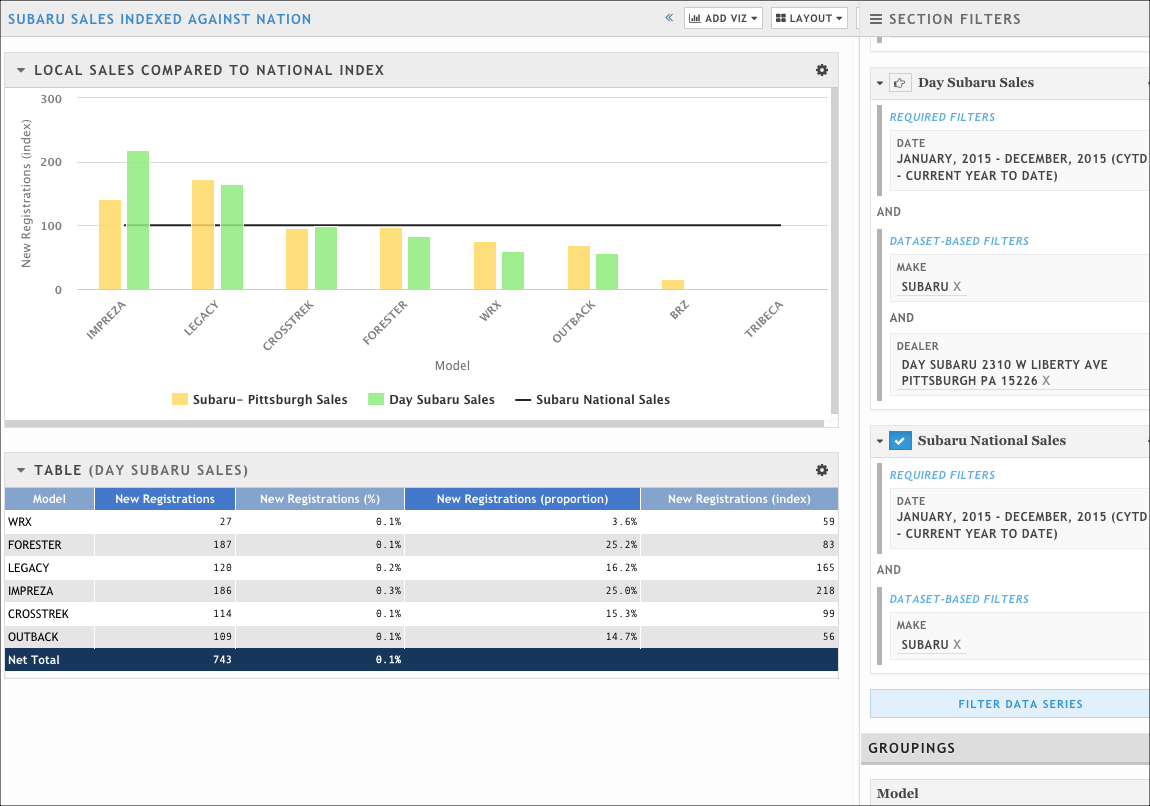
This tells an interesting story; in Pittsburgh generally, but at Day Subaru specifically, the Impreza and Legacy significantly over-indexed compared to national sales.
The table gives us the dealer's market share in the New Registrations (%) column. It also gives us the precise index value for the model as it compares to the current context series (nationwide) in the New Registration (Index) column.
Now, let say we want to focus less on the national market and more on the Pittsburgh market. How is Day Subaru doing compared to the Pittsburgh market?
The first thing we need to do is to change which target series is our context. Instead of using National Subaru Sales, we'll use Pittsburgh Subaru Sales as the context series, then click Update Presentation.
Now we need to configure our visualizations. We want to update our column chart to reflect that the Y axis should show an index value, that the index value should be represented as a line instead of a column, and to remove the National Subaru Sales target series altogether. What we see should look similar to this:
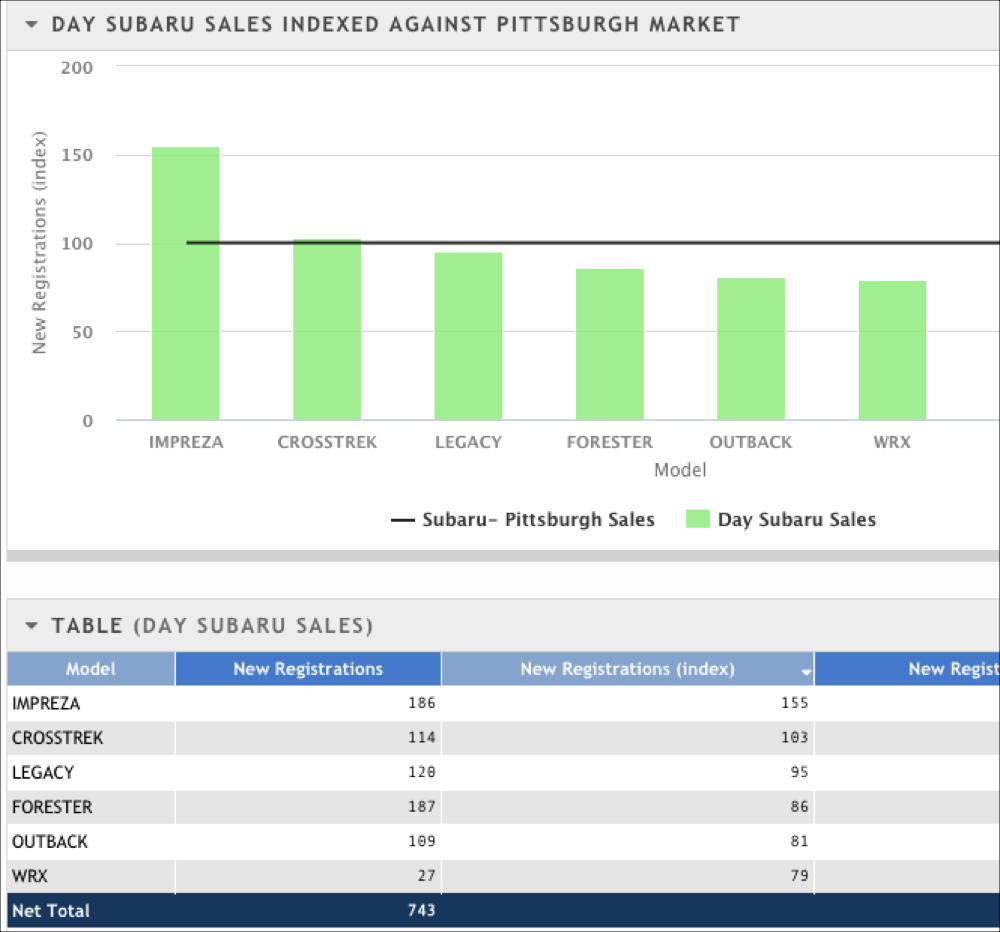
This tells a different story than the previous image, doesn't it? The Crosstrek was under-indexing when compared to national Subaru sales. However, it's doing quite well when you look at it in the context of the overall Pittsburgh Subaru market and Day Subaru in particular. In addition, while the Legacy looked to be highly over-indexing in the previous graphic by both the Pittsburgh market and Day Subaru, Day Subaru sales of the Legacy seem to slightly under-index when compared to the Pittsburgh market.