Most visualizations contain at least one calculated value to help you understand the data you see. The three values that Rhiza calculates are:
- Proportion: shows the distribution of data within a population
- Percentage: compares two populations and shows how they differ; useful for things like market share and trends
- Index: compares two populations and shows how they differ; useful for things like market share and trends
Proportion
Proportion is the most common calculated value you'll see in a table; it is calculated by dividing the number of respondents (or car registrations, or other data point) for each data group by the overall number of respondents (or car registrations, or data points) in the target series.
For non-survey-style datasets, the individual proportions must always add up to 100%. For survey-style datasets, the proportion might add up to more than 100% if you have a question where respondents can pick multiple answers (for example, "Quick Service Restaurant Eaten Last 30 Days").
If it helps, you can think of proportion as a fraction, with the numerator as the individual number of respondents in your query and the denominator as the entire set of respondents in the target series.
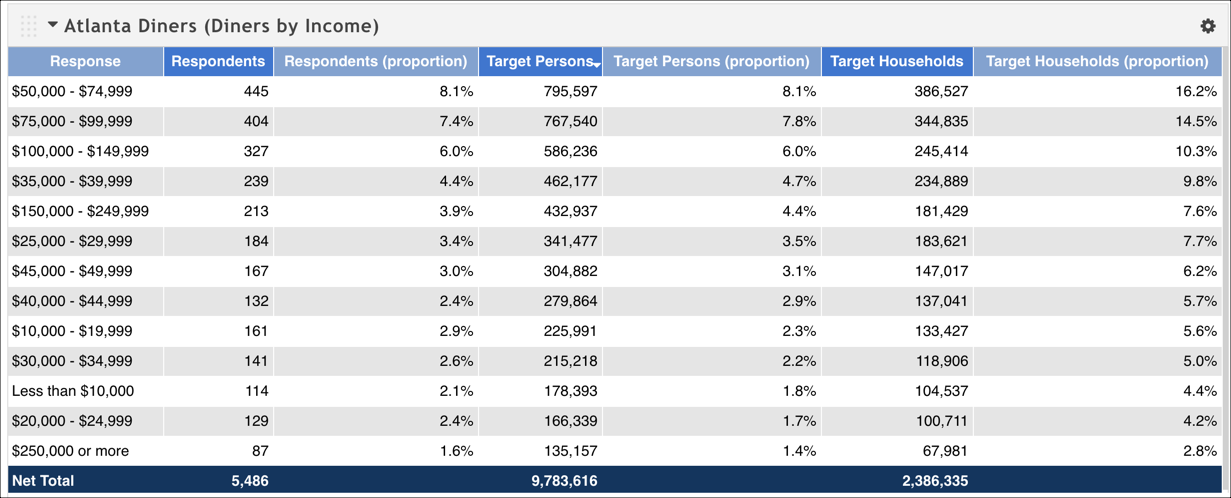
The following table shows two proportions: one for the raw number of respondents and one for the weighted number of individual respondents (this particular dataset models the data to project numbers that represent the given market; weighted individuals are called Target Persons). In this example, we defined a target series that returned people in the Atlanta market who dined out, and grouped the responses by income level. When you divide the respondent count for an income level by the net total, you get the proportion. It essentially says, "Out of all the diners in Atlanta, 8.1% of them make between $50,000 and $74,999 per year."
Index
The index is used as a comparison tool. As such, it requires you to create and use a context series so that you are comparing two populations: the target demographic in your data series, and the larger universe in your context series. Essentially, the context series is your base.
Index is calculated by dividing the target series respondent proportion by context series respondent proportion, then multiplying the result by 100:
Index = (Target series respondent proportion / Context series respondent proportion) * 100
A value of 100 typically means that your target demographic or product is doing well compared to some larger entity; values higher than 100 mean that it's doing very well comparatively.
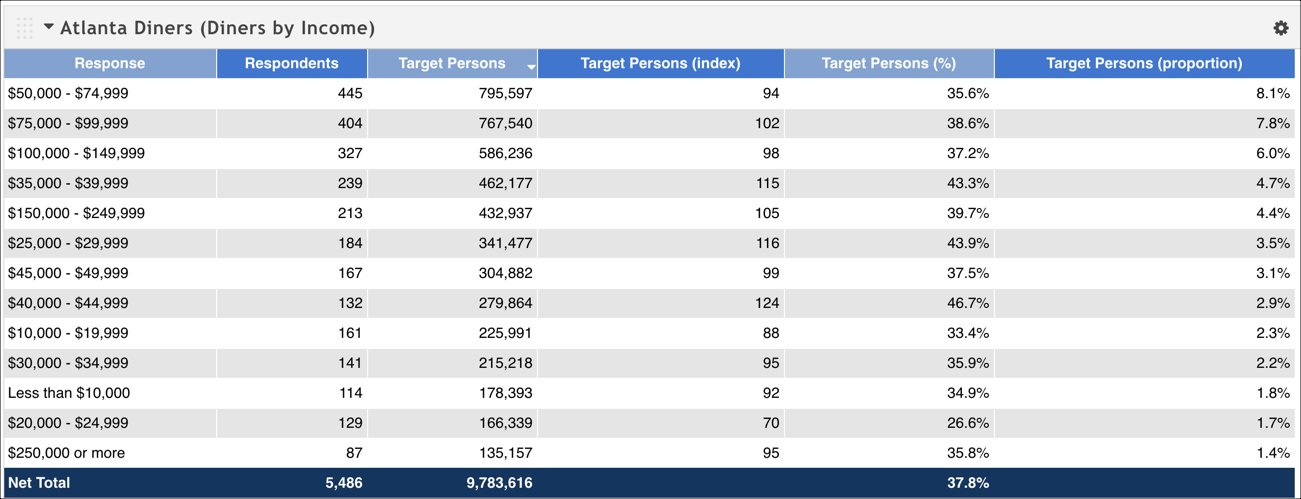
Let's go back to the example we used for proportion. We had a target series that examined diners in the Atlanta market, and then grouped the results by income level. To calculate the index, we need to add a context series that encompasses some larger set of respondents. In this case, we'll add a context series that includes all diners nationwide. Our resulting table now includes an index value.
Remember that one of the largest proportions of diners made between $50,000 and $74,999 per year. However, when we look at the index, we see that, when compared to all diners nationally, they under-index. That is, that demographic in Atlanta eats out less frequently when compared to the rest of the dining-out nation. However, diners in Atlanta who make between $40,000 and $44,000 per year are almost 1.25 times more likely to eat out than the average national diner in that income bracket.
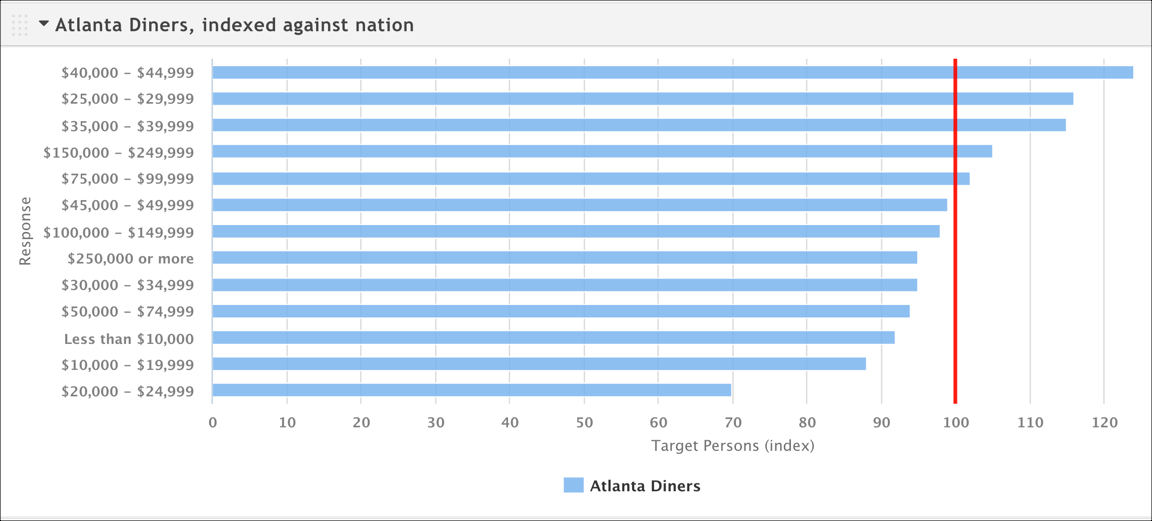
You can also show the index as a line on a bar or column chart to help you visualize it.
Percentage
Percentage is another comparison tool. As such, it also requires you to create and use a context series so that you are comparing two populations: the target demographic in your data series, and the larger universe in your context series.
It is calculated by dividing the target series respondents by the context series respondents, then multiplying by 100:
Percentage = (Target series respondents / Context series respondents) * 100
Because this calculation is so useful for things like market share, let's use a slightly different example to illustrate it. We've defined a target series to examine soda drinkers in the Philadelphia market, and grouped them by the brand of soda they drink most often -- we want to know what brands have the most market share. We've also defined a context series that includes all soda drinkers in the larger Eastern Pennsylvania market. Our resulting table looks like the following.
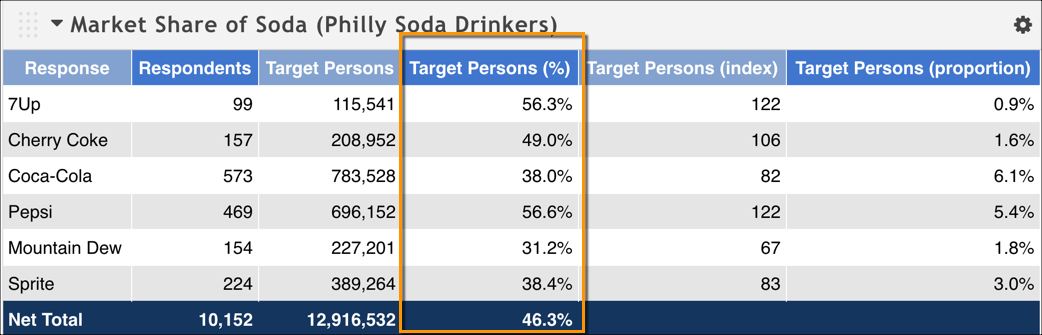
When we divide the number of responses for Coca Cola by the number of responses given in the context series, we see that 38% of the weighted individual respondents (called Target Persons in this dataset) in Philadelphia prefer Coca Cola; that's its market share, essentially. Note that the percentage in the Net Total row does not equal 100. This calculation is showing the market share for the defined demographic -- in this case, soda drinkers in the Philadelphia DMA. We should expect this percentage to be smaller when compared with the context series (in this case, the bigger Eastern Pennsylvania market) -- it makes sense that Philadelphia soda drinkers account for roughly half of the soda drinkers in that market.