You can customize a table to show exactly the data you want to see. Remember that each table can show the data from a single target series.
Add a table visualization to your presentation.
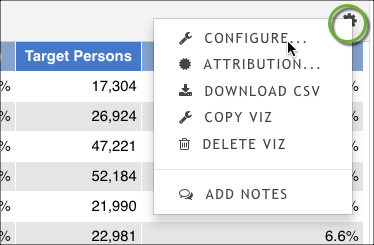
Click Configure from the gear icon menu at the top of the table to open the configuration dialog box.
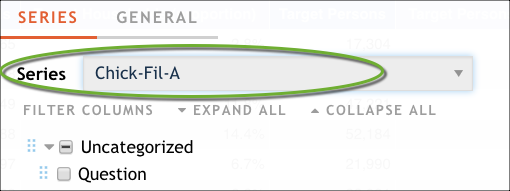
Use the Series menu to specify which target series you want to show in the table. A table can represent a single target series.
Customize the columns:
- By default, all columns are shown in the table. Clear any that you don't want to display.
- Drag columns to reorder them in the table.
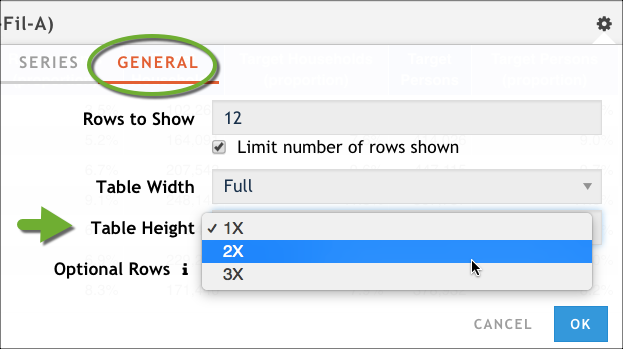
Specify the table height from the General tab. By default, tables have a height of 1X, but that might not be tall enough to display all of the rows you want to show. (You can scroll in a table to see all of the rows; the height you pick depends on what you want to see in the presentation. Experiment with the height option to find the one that works the best for you.)
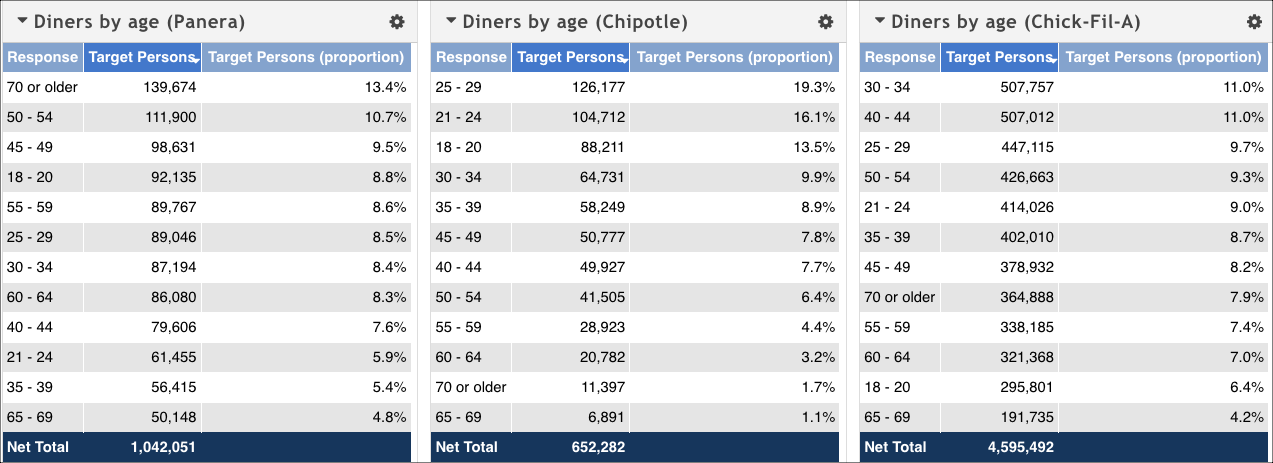
Specify the table width from the General tab. By default, tables are full width, which means they can easily show all of the columns.
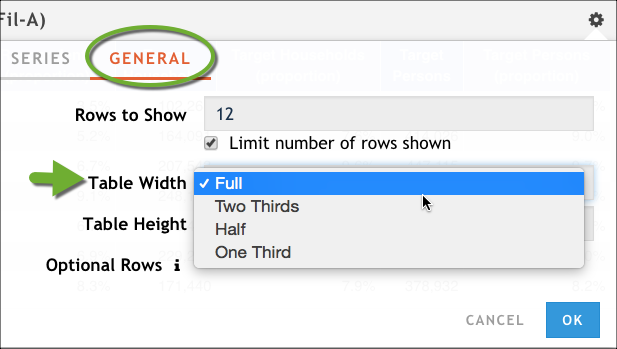
However, if you want to show only a few columns and want to have a few tables next to each other in order to compare the data, you might want to set the width of each table to something smaller and then position them side-by-side. In this example, we can see that Panera's diners tend to be mostly older, while Chipotle's diners are the youngest and Chick-Fil-A's fall somewhere in the middle.
Customize the rows by using the options in the General tab.
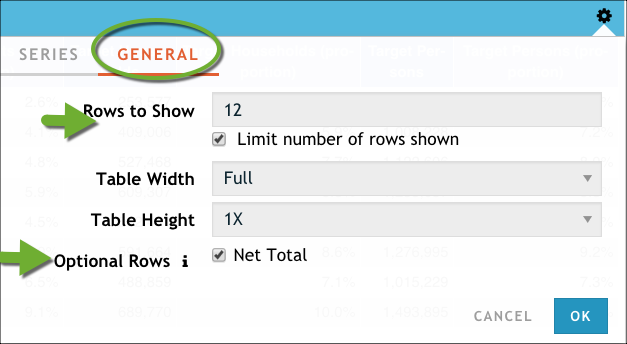
Configuring a table by selecting how many rows to show and whether to include a net total row:
- Use the Rows to Show option to indicate how many rows of data you want to display. it can be used in conjunction with the Limit number of rows shown option to show only a select number of rows in the table. See Example: Configure a table to show the top or bottom 5 results.
- Use the Net Totals option to add a Net Total row to the bottom of your table. This row calculates the net total for all responses, not just those shown in the table (important to know if you decide to use Rows to Show to restrict the results), and it takes into account situations where a respondent has selected more than one answer for a question (important to know if you are working with a survey-style dataset).
Click OK.