After you create a presentation from a template, you can do some quick customizations before you share it with your client. This topic shares some customizations that are common to all visualizations.
Update titles
We strongly recommend that you take a look at the title of your presentation, as well as the titles of all of your visualizations. Because the presentation was created from a template, the names are generic. You might consider adding client-specific information, like a station or business name, to give the visualizations more context and to make them more personalized.
Deleting a Visualization
Each template was carefully constructed with the visualizations thought to best tell a story, but sometimes a visualization just doesn't work well with the data you happen to be looking at. We encourage you to be critical when looking at your presentation and, if necessary, delete any visualization that doesn't tell the right story.
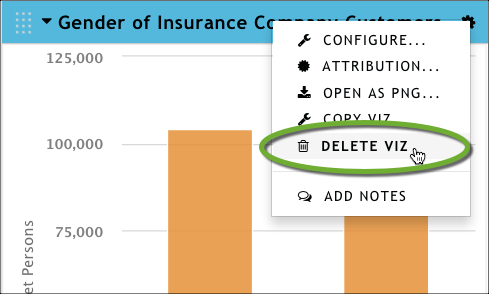
To delete a visualization, click the gear icon at the top right of the visualization, and then click Delete Viz. After you delete a visualization, you might need to do a bit of reformatting to make the remaining visualizations appear in an order you like. See the next section in this topic for more information.
Change visualization size or location
Although the visualizations in a presentation are placed and sized in a way feels tells a good story, you might want to make some changes to the visualizations' locations or sizes. Use the information below to help you.
Drag and Drop
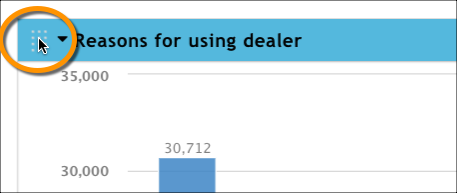
The drag-and-drop positioning in makes it a snap to move tables, maps, and charts around. Simply grab a visualization by its handle (located at the top left) and drag it to the position you want.
If you place your visualizations next to each other in the browser, that layout will not be preserved in the generated PowerPoint. Each visualization is placed on its own slide.
Resize
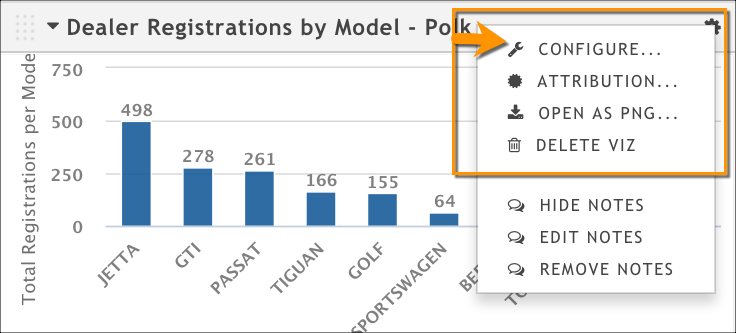
In a presentation generated from a template, the visualizations will be in a range of heights and widths. You can change both by using the visualization's configuration dialog box. Access it by clicking the gear icon at the top right of the visualization, and then clicking Configure.
The width and height options are all on the General tab (the actual option names vary depending on the visualization type, as shown in the following screen capture).
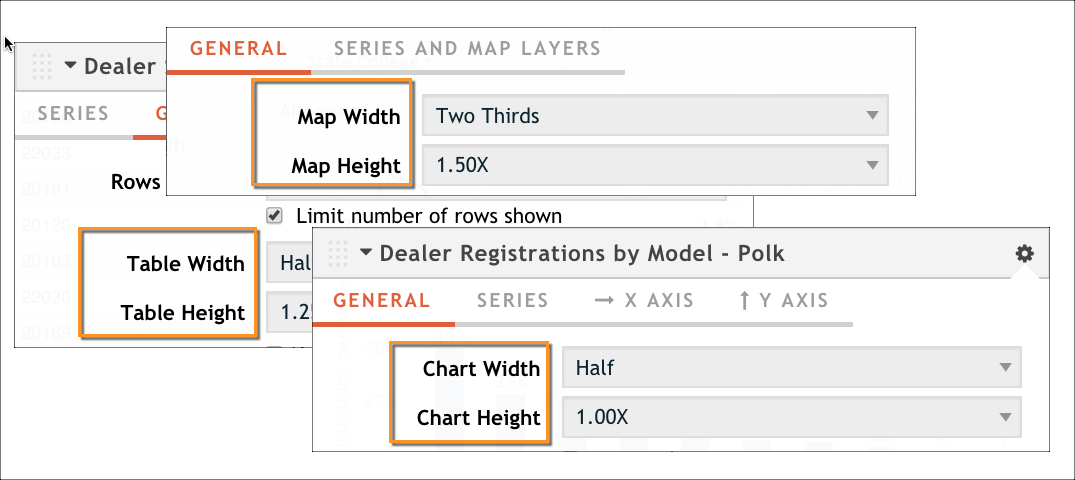
Find the width and height options on the General tab.