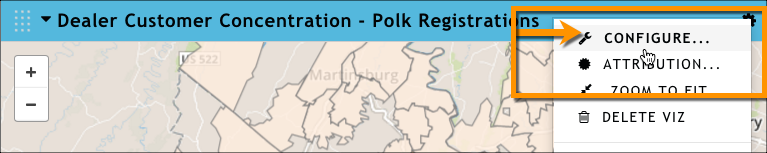
There are a few customizations you can make to maps in your presentation. To make any of these customizations, you must open the configuration dialog box by clicking the gear icon at the top of the map, and then clicking Configure.
Change the title
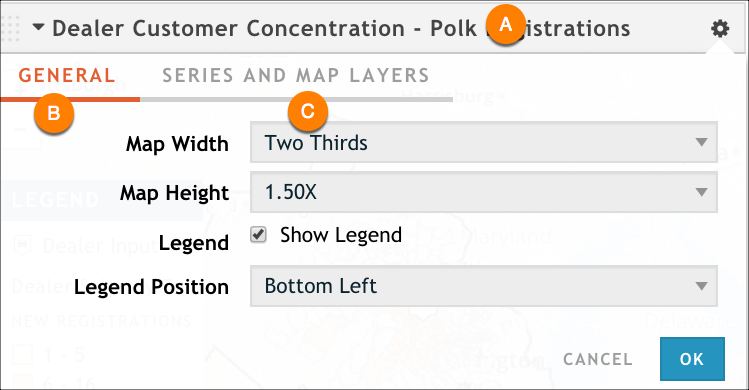
Click the current title (A) to make it an editable text box. Make any updates you want, and then click OK to save your changes.
Change the size or adjust the legend position
Use the options on the General tab (B) to change the map height and width. For more information, see Customize a Rhiza Basic presentation.
You can also use the Legend Position option to reposition the map's legend.
Customize The Appearance of the Map
Use the Series and Map Layers tab (C) to make changes to the appearance of your map.
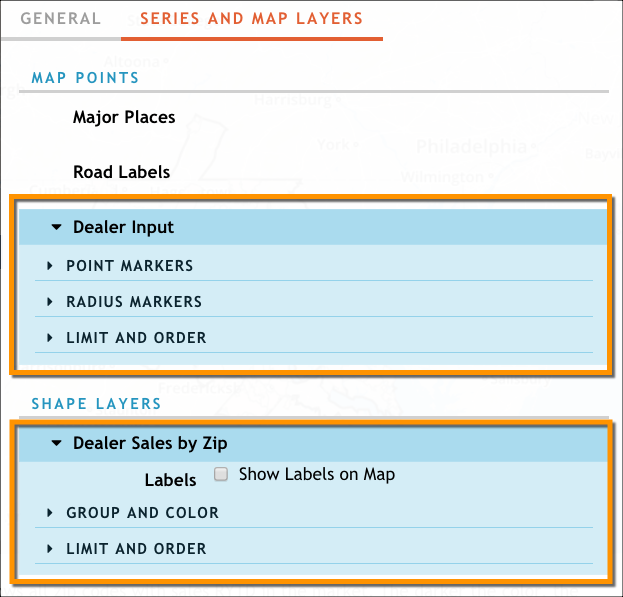
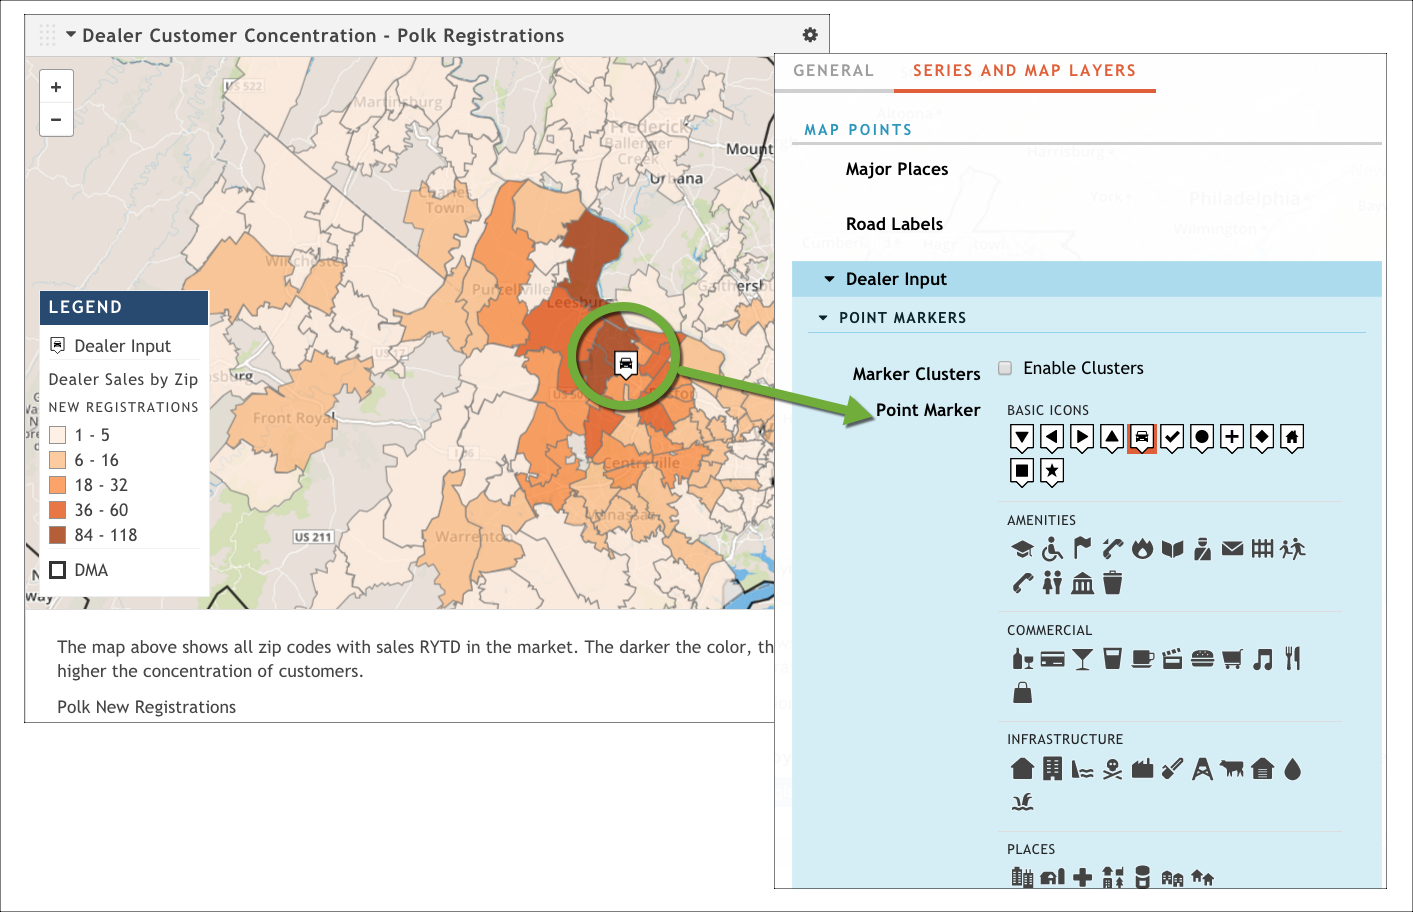
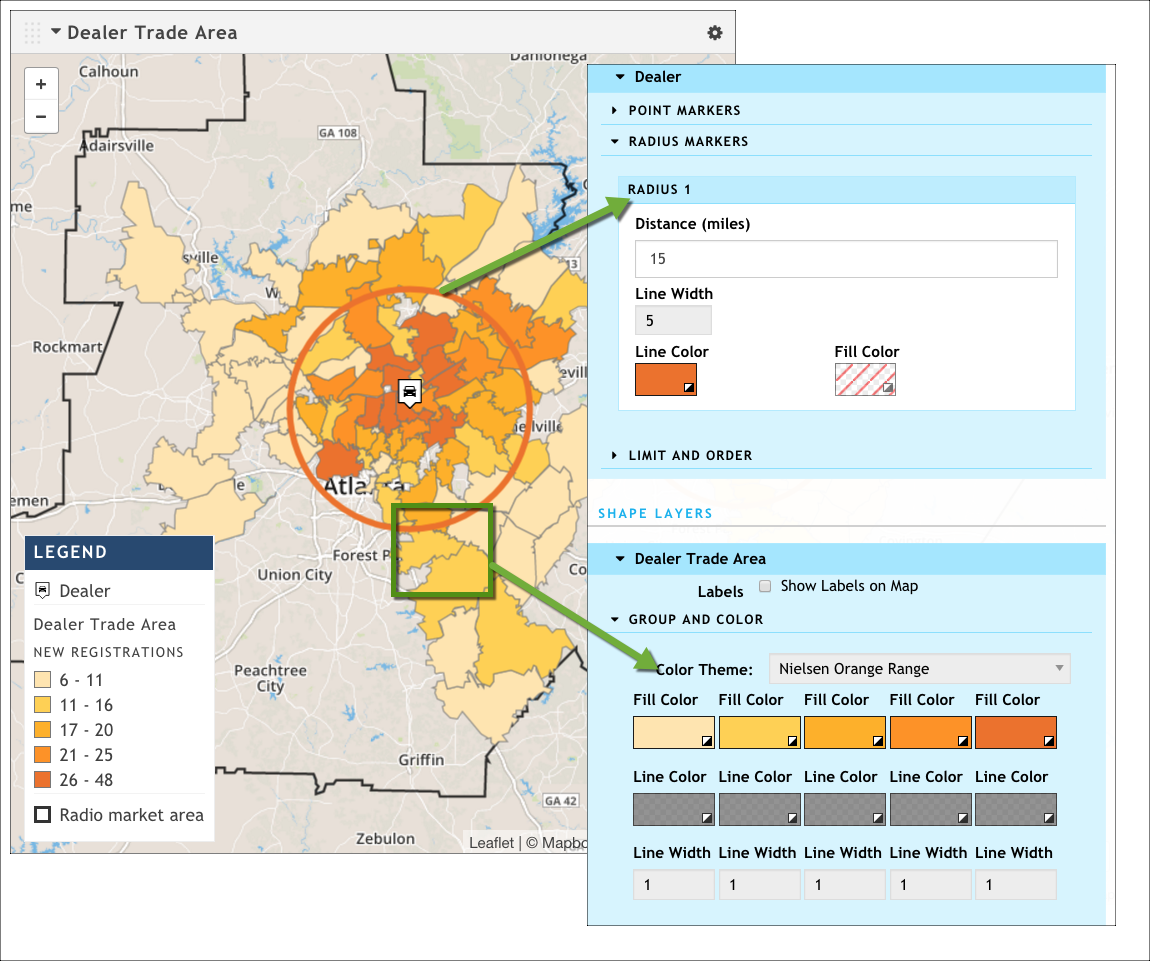
If you have one or more points on a map (for example, a car dealership, or retail store locations), you can use the Point Markers, Radius Markers, and Limit and Order expanding sections to modify how those are displayed on the map, or how many of them are displayed. The following graphic shows a map with a single point plotted, as well as where in the map configuration dialog box you can change that icon.
If you want to change the colors used on the map, expand the Group and Color section and update the Color Theme option.
Finally, you can use the Series and Map Layers tab to customize how many shapes (typically ZIP Codes) to show on your map.
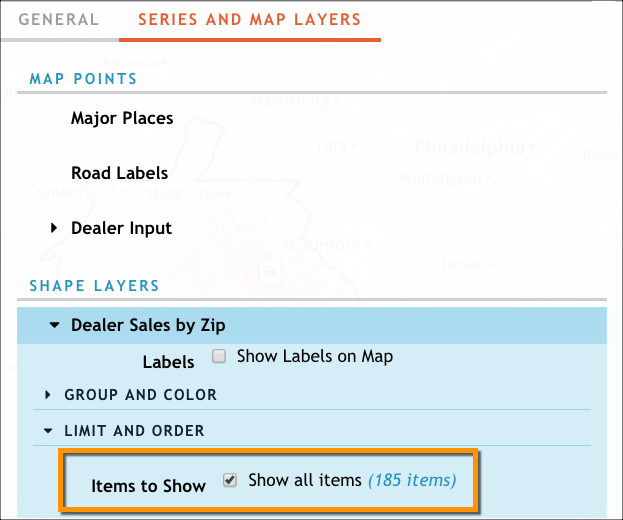
If you clear the Items to Show option, you are prompted to specify how many shapes you want to show on your map. This option can be useful if you want to show only a certain number of the top shapes, in terms of data values (the top 10 ZIP Codes with highest station viewership, for example).