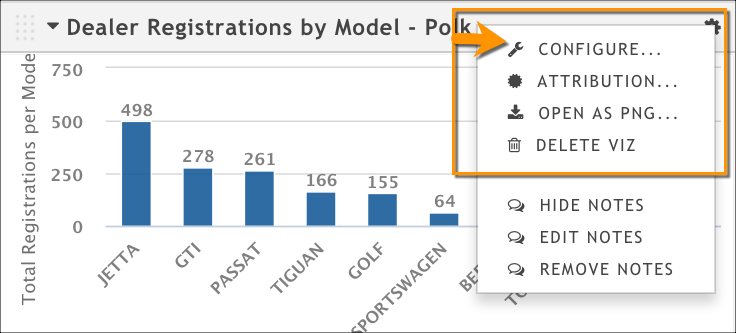
There are a few customizations you can make to bar and column charts in your presentation. To make any of these customizations, you must open the configuration dialog box by clicking the gear icon at the top of the chart, and then clicking Configure.
Change the title
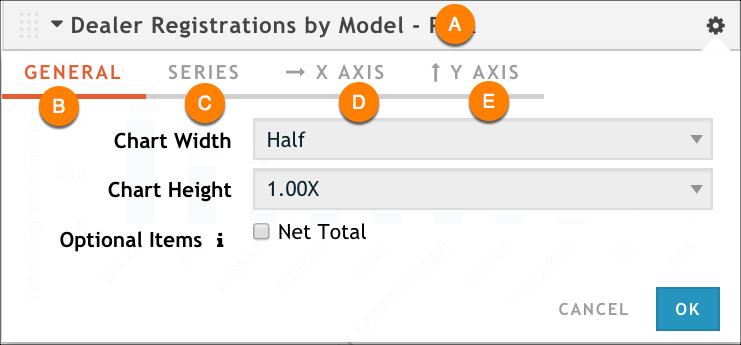
Click the current title (A) to make it an editable text box. Make any updates you want, and then click OK to save your changes.
Change the size
Use the options on the General tab (B) to change the chart height and width. For more information, see Customize a Rhiza Basic presentation.
Customize column color or add labels to columns
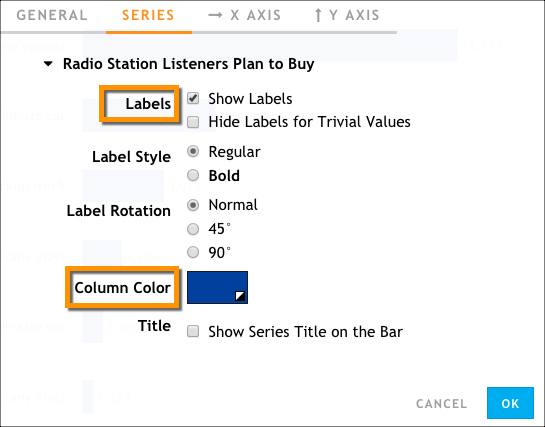
Use the Series tab (C) to add labels to your columns if you want to show specific values at the end of each column. You can also change the color for the columns.
Rotate Labels on the X-axis
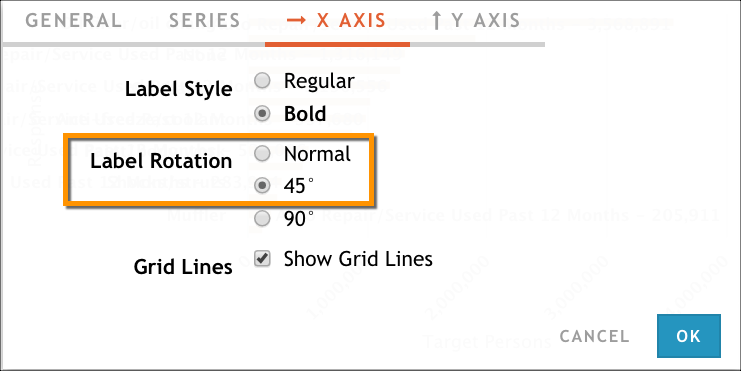
On a bar chart, use the X AXIS tab (D) to rotate the labels that are shown along the X-axis of the chart. This can be useful if your labels are long and don't fit when displayed horizontally.
If you are configuring a column chart, the X-axis and Y-axis are reversed. If you are configuring a column chart, the following configuration options appear under the Y-AXIS tab instead.
Limit the Items to Show and Rotate Labels on the Y-axis
Sometimes you might not want to show all the items on a chart; maybe you want to show only the top 5 or 10 results—or maybe a visualization is configured to show only a few results and you want to see them all. On a bar chart, use the Y AXIS tab (E) to set the number of items you want to display. You can also rotate the labels that are shown along the Y-axis of the chart. This can be useful if your labels are long and don't fit when displayed horizontally.
If you are configuring a column chart, the X-axis and Y-axis are reversed. If you are configuring a column chart, the following configuration options appear under the X-AXIS tab instead.
