When you create a new presentation, you start with a single section. In that section, you need to declare the dataset you want to use, define the data series you want to examine, and specify how to group the results. From there, you can add and customize visualizations, add sections, and further refine your presentation before sharing it or exporting it to Microsoft PowerPoint.
Steps
Log in to Rhiza.
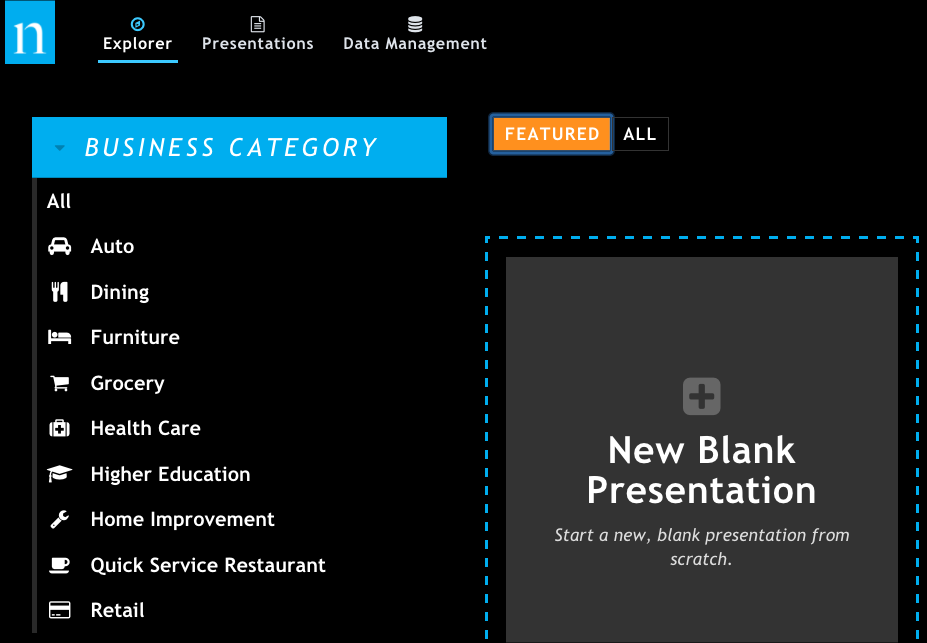
Start a presentation by clicking New Blank Presentation from the top row of the Sales Explorer.
Click the title at the top of the presentation to make it an editable text box; enter a new name and click OK. After this change, your presentation should automatically be saved, and all future changes will be saved. If you still see the Save Presentation button in the upper right corner after renaming your presentation, click the button.
Specify the data you want to see by defining one or more target series. See Add or modify data in your presentation for more information.
If you haven't done so already, click Update Presentation to create the visualization based on the data you specified. Depending on the size of the dataset and the complexity of your target series, it can take a few minutes for the system to display the results.
Optionally, manipulate the data and visualizations so you see exactly what you want, how you want.
Optionally, add additional sections to tell different parts of the story.
Optionally, generate a PowerPoint version of your presentation.