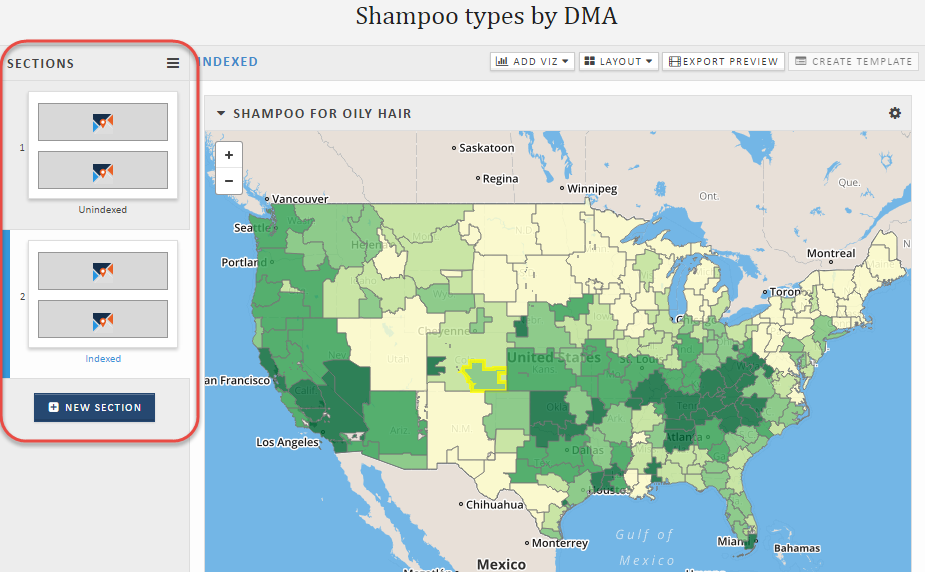
A section is like an independent chapter in your presentation; each section can have different datasets, filters, and visualizations.
For example, you could create data series that track viewership for various television shows, and use different sections to aggregate the data by different categories (possibly demographics like gender, income level, whether the household has children, or even something like how often the household goes to the movies). You could also create a presentation comparing restaurant preferences by indexing against a different data series in each section, or focusing each section on a different brand.
The section currently being displayed in the center panel is highlighted in the Sections panel.
Section Example: Auto Sales
This presentation uses a vehicle registrations database to explore Chevrolet sales in Cleveland, Ohio.
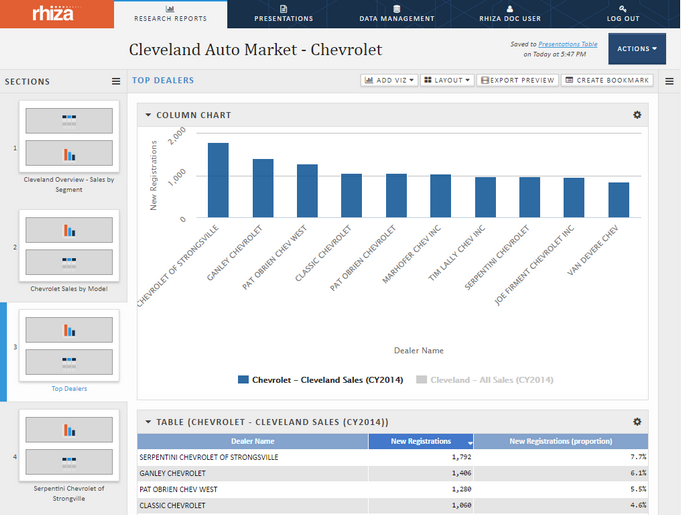
This presentation uses different sections to show vehicle registrations in the market; first by segment, then by Chevrolet model. One section shows the top selling dealers, and additional sections look at a few dealers' sales in more depth. Customized section names help you navigate to the information you want.