This template guide walks you through a few of the most common Rhiza Basic use cases and gets you on your way to creating the kind of sales story that will win over your clients.
- How to tell a good story with templates
- Go-to templates
- Example: Creating an auto story
- Tips for being successful with Polk
- Example: Creating a business story
- Troubleshooting: My business isn't listed in the template input field
- Example: Prospecting
- Prospecting: Dealer lists
- Prospecting: Business Lists
- Want to make your presentations great?
How to tell a good story with templates
We recommend that you approach your sales story in this order:
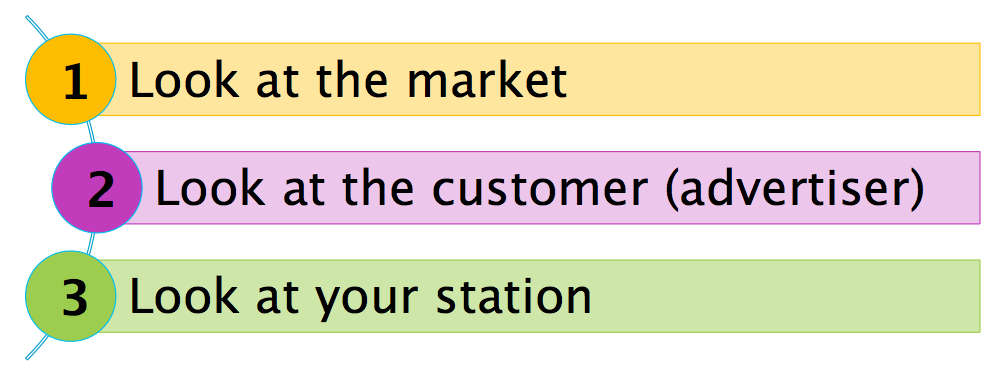
Market, then advertiser, then station
Understand your market first; know what the trends are overall in the DMA for the kind of ad sales story you're planning to pitch. Market-based templates are all colored yellow.
Next, take a look at the specific customer you want to pitch. The purple advertiser-based templates let you focus on a specific business or dealer to provide insights on its business and customers.
Finally, use the green station-based templates to show a business or dealership how advertising on your station will help them grow sales.
Go-to templates
| Auto | Business (Dining example) | Prospecting |
|---|---|---|
| Auto Market Summary Radio Metro | Quick-Serve Restaurant Market Summary Radio Metro | Dealer Look Up By ZIP Code |
| Dealer Report | Quick-Serve Restaurant Consumer Profile Radio Metro | Dealer Look Up By Make and ZIP Code |
| Dealer’s Competitive Analysis | Radio Station Listeners and Quick-Serve Restaurants | Business Look Up By Company Name |
| Radio Station Listeners in Auto Dealer Radius | Radio Station Summary in Radius | Business Look Up By ZIP Code |
| Radio Station Listeners and Auto Dealer | Business Look Up By SIC Code |
Example: Creating an auto story
To tell a good auto story, start by looking at the auto market as a whole. Examine the Nielsen Radio Metro Area according to overall sales, dealers, make, and model. Start with these three templates:
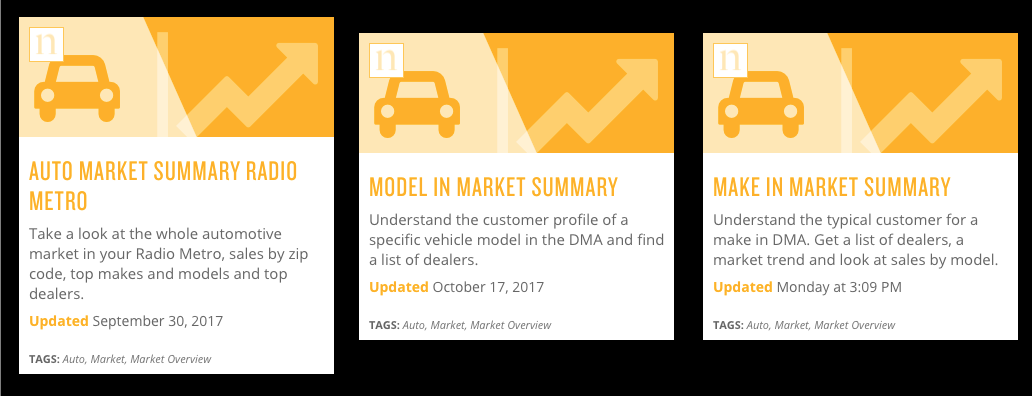
Market-based auto templates (click to enlarge)
These templates can help you find specific information about auto sales in your metro area:
What are the market trends: What's selling the best, and who are the top dealers? [Auto Market Summary Radio Metro]
Where do buyers live? Find the top ZIP Codes for new sales. (Starting thinking about whether your station has reach in those ZIPs; we'll look at that in more detail with the station-based templates.) [Auto Market Summary Radio Metro]
Find a list of dealers for a particular make or model, and learn about the typical customer. *[Make in Market Summary *& Model in Market Summary]
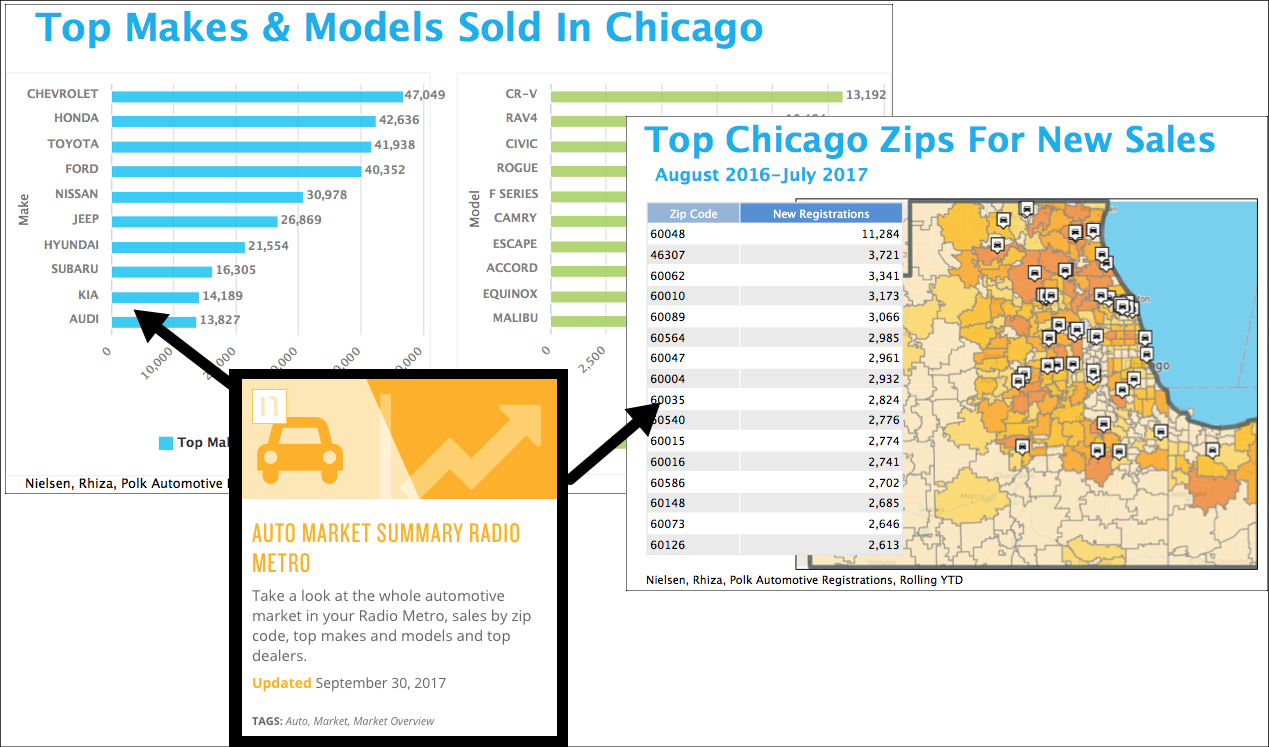
Example PowerPoint output from the Auto Market Summary Radio Metro template (click to enlarge)
Next, move on to the dealer-specific templates.
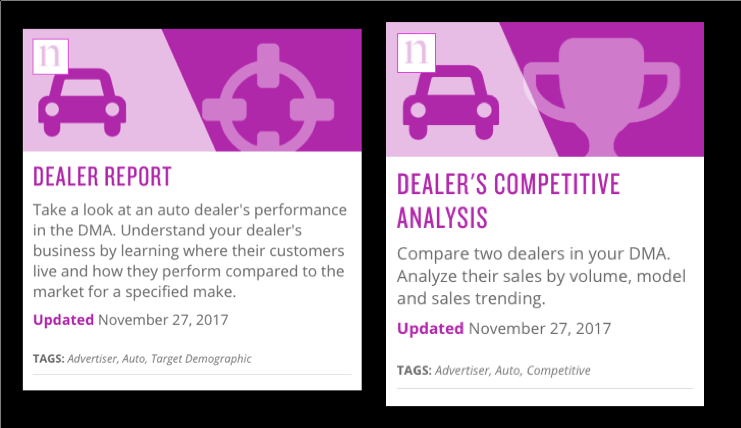
Advertiser-based auto templates (click to enlarge)
Find basic information on dealer sales as well as demographic profiles of its customers. The competitive analysis template provides a dealer with brand-new information they can’t get anywhere else.
Build trust with a dealer by showing familiar information, like sales numbers and how the dealer is doing compared to the overall market. [Dealer Report ]
Wow the dealer with coveted competitive information: compare sales and market share by month (and also against the market), and visually see whether the dealer's and competitor's sales territory overlap (and if so, where). [Dealer's Competitive Analysis ]
See how the dealer is doing against the competition and the market when it comes to which vehicle segments (types) it's selling. [Dealer's Competitive Analysis ]
Gain insight into the dealer's customer demographics. [Dealer Report ]
Show the dealer his sales territory (trade area) on a map.*[Dealer Report * & Dealer's Competitive Analysis ]
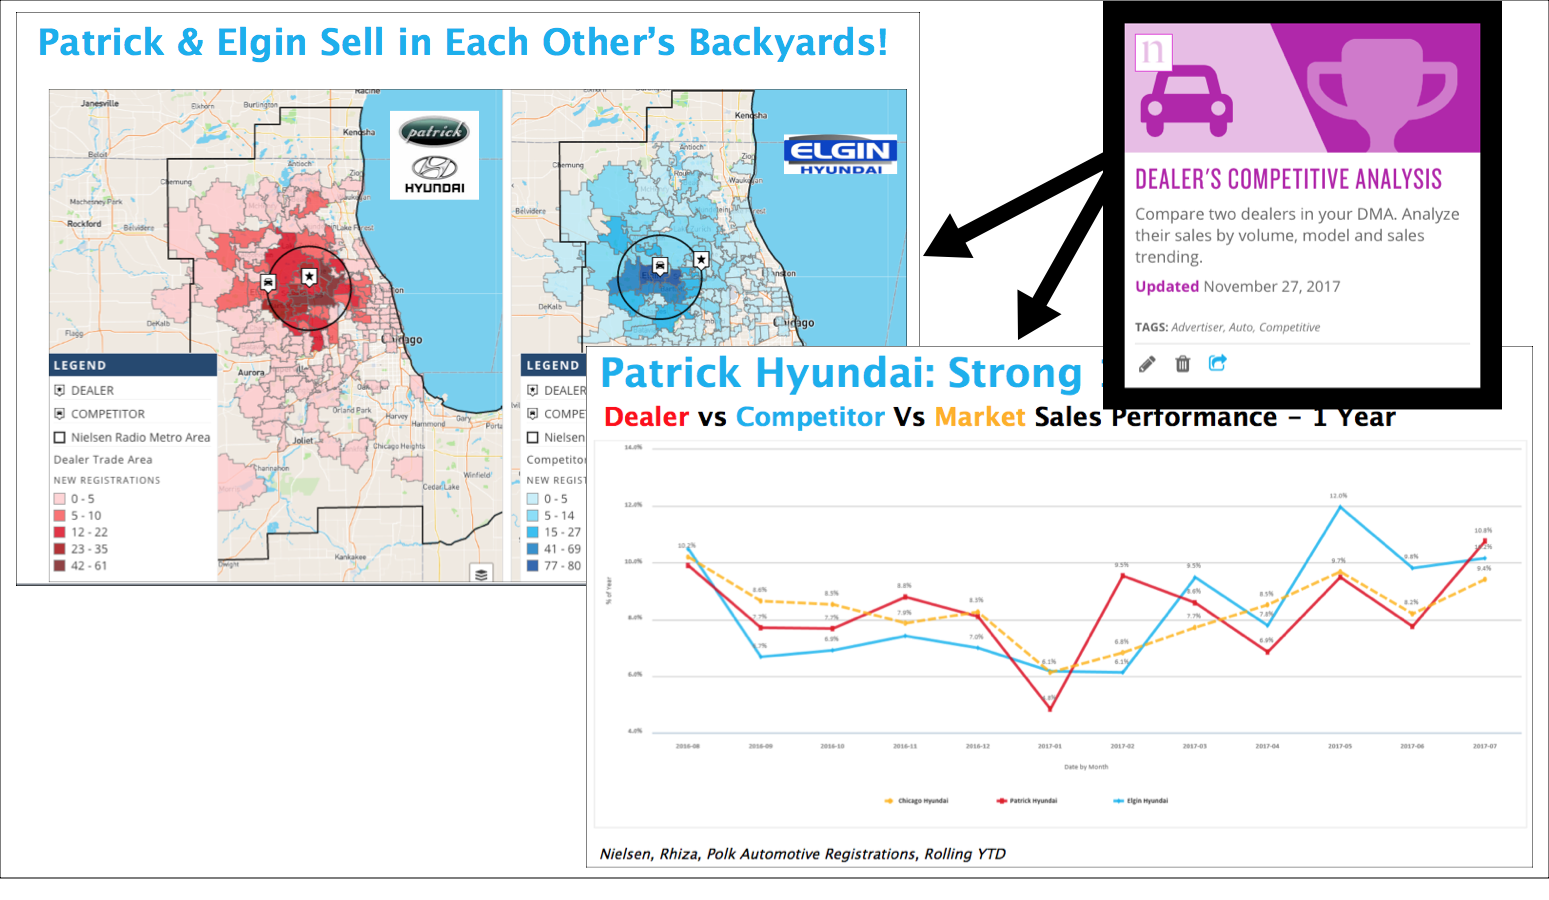
Example PowerPoint output from the Dealer's Competitive Analysis Radio Metro template (click to enlarge)
Finally, use the station-based templates.
The radio station-based templates for an auto story (click to enlarge)
The visualizations in these templates are designed to show how advertising on your station can help the dealer expand his business.
Visually show the dealer how your station reaches his or her core sales area (the radius). To demonstrate growth opportunities, show the dealer how many listeners your station reaches outside the dealer's core sales area, too. *[Radio Station Listeners in Auto Dealer Radius *& Radio Station Listeners and Auto Dealer]
Show the top broadcast stations within the dealer's trade radius (remember: you can delete this visualization if your station isn't in a good position on the ranker) [Radio Station Listeners in Auto Dealer Radius]
Find the daypart that has the most listeners for your station, within the dealer's trade radius. [Radio Station Listeners in Auto Dealer Radius]
Learn more about the station listeners inside the dealer's core sales area: How old are they? How much do they earn? [Radio Station Listeners in Auto Dealer Radius]
Demonstrate that your listeners are willing to travel more than the dealer might expect to get a good price, and then see just how much listeners plan to spend on a new car over the next year. [Radio Station Listeners and Auto Dealer]
Help a dealer find new customers by digging deeper into who purchases the top-selling car segments . [Radio Station Listeners and Auto Dealer]
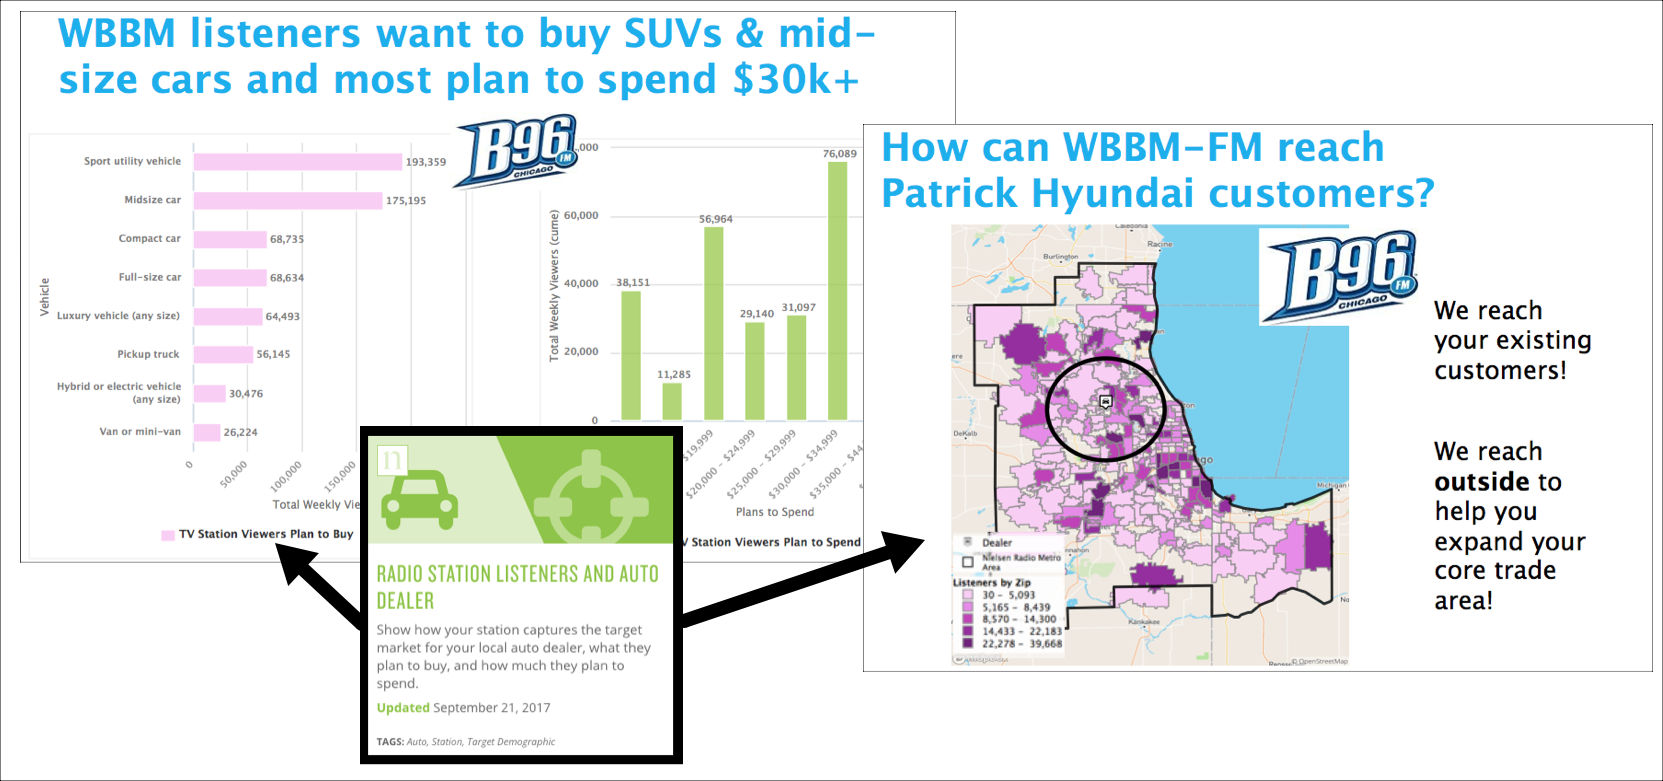
PowerPoint output from the Radio Station Listener and Auto Dealer template (click to enlarge)
Tips for being successful with Polk
IHS Polk reports all new car sales (registrations) in the U.S. at the ZIP-Code level, broken down by make, model, and segment (type of vehicle, like an SUV, a mid-size car, etc.). Most states and manufacturers report data in a way that we can look at which registrations are attributed to specific dealers. For more information on Polk reporting methods, see Polk New Registrations.
However, some states and makes are non-participating: They don't report registrations in a way that can be easily tracked back to a dealer. As a result, you might have a hard time finding the results you want in Rhiza. That's why it's important to understand which states and makes are non-participating, as well as learn how to use Rhiza in these situations.
Participating State & Participating MakeData available: All new vehicle registrations by dealer Source: State and manufacturer | Participating State & Non-Participating MakeData available: All new vehicle registrations, many by dealer (some UNKNOWN) Source: State |
Non-Participating State & Participating MakeData available: All new vehicle registrations, many by dealer (some UNKNOWN) Source: Manufacturer | Non-Participating State & Non-Participating MakeData available: All new vehicle registrations, but none by dealer Source: None |
For more details and specific reporting/non-reporting makes and states, please refer to the Polk New Registrations page of the Data Catalog.
Troubleshooting: I'm in a participating state and want to pitch to a dealer who sells a non-participating make
Don't worry: there's still data available because Polk works directly with the state to collect registration data. In many cases, Polk can still show which dealership the sale came from.
If you find yourself in this situation, start with the Make in Market Summary template.
- Do the numbers look reasonable for your dealer?
- Given your knowledge of the dealer, does the dealer seem to rank appropriately in the list of all dealers?
- Ensure that the majority of registrations for the make aren't attributed to UNKNOWN.
If your dealer's numbers look reasonable, use the Dealer Report to find more information specific to your dealer.
Otherwise, use the Radio Station Listeners in Auto Dealer Radius template.
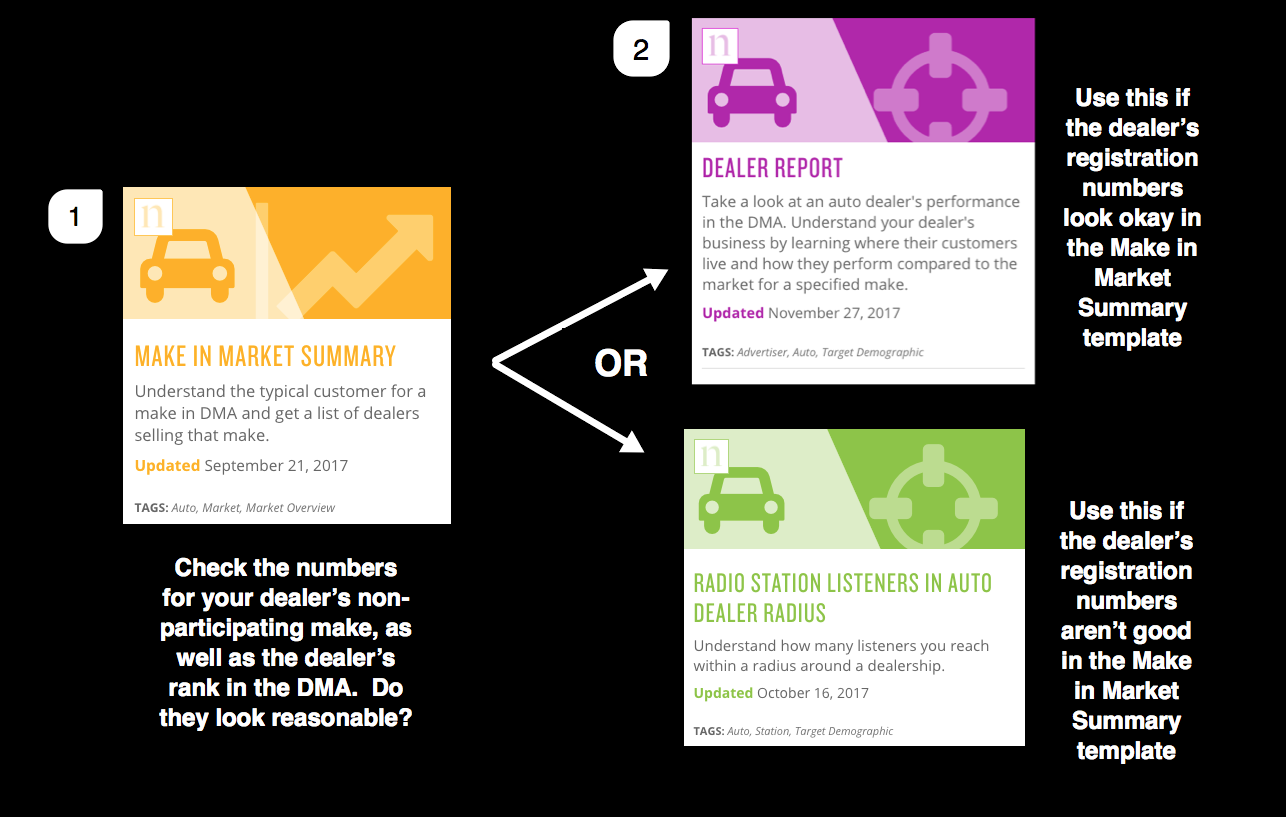
Troubleshooting: Telling a story when you have participating state with a non-participating make (click to enlarge)
Troubleshooting: I can't find the dealer I want in the template's input field
Sometimes dealers have slightly different legal names than those they use to advertise with. In these cases, you can use a dealer look-up template to help you find the dealer; you can search by ZIP Code or -- more specifically, by make and ZIP Code.
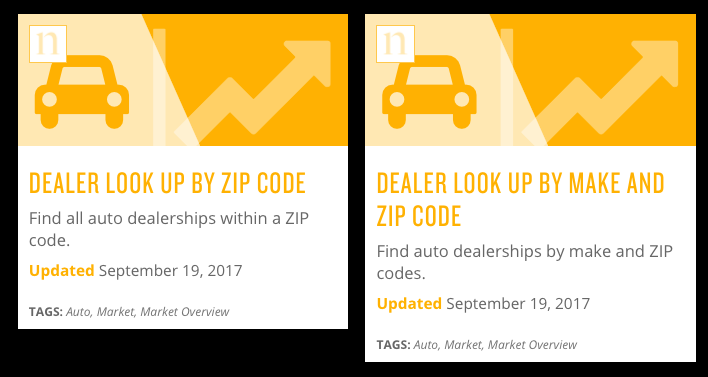
Look-up templates can help you find the dealer you need (click to enlarge)
Troubleshooting: I'm pitching to a dealer who sells a non-participating make in a non-participating state
In this situation, Polk won't be able to give you the data you need because it's not available from the state or the manufacturer. The way to be successful is to realize this fact and to instead tell the story by showing how your station covers the area around the dealership. Use the following Scarborough-based radius around points template to enter the dealer's address and show how many viewers your station reaches in the dealer's trade area.
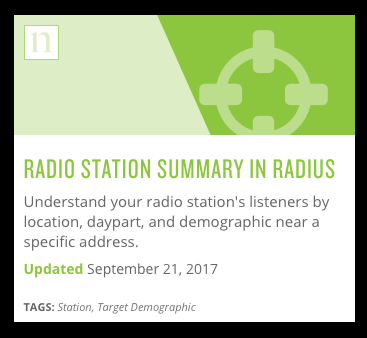
Use the Radio Station Summary in Radius template when Polk data is not available for a dealer (click to enlarge)
Example: Creating a business story
lets you tell a story for individual businesses using AggData (and some Scarborough Local Survey) data. Before we dive into the templates themselves, let's take a quick peek at some commonly asked questions about AggData.
Question: What is AggData?
Answer: It's a dataset full of business locations around the globe.
Question: Where does the data come from?
Answer: It comes from web scrapers -- tools meant to extract data from the web.
Question: What is AggData best used for?
Answer: Large retailers that have a good web presence.
Question: What might not be included in AggData?
Answer: Local chains and small businesses.
In this example, we're going to use restaurants. As always, we'll start with the market. Use one of these templates, depending on whether you want to look at a quick-serve or sit-down dining restaurant.
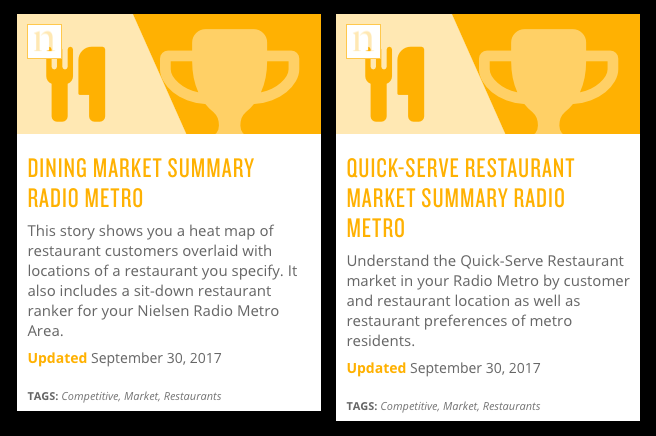
Market-based templates for a restaurant story (click to enlarge)
The visualizations in these templates provide both a general and a competitive analysis of the market.
Show the number of people in a radio metro who ate at a sit-down or quick-serve restaurant in the last 30 days.
Overlay your restaurant's position on a map with the diners' locations to visually show the overlap between diners and restaurant location.
Rank the most popular restaurants in the radio metro (remember: you can always remove this visualization if it doesn't tell a good story for the restaurant).
Next, we'll look at the advertiser-based templates to learn more about our customers in the radio metro. These templates use Scarborough Local Market Survey data instead of AggData information.
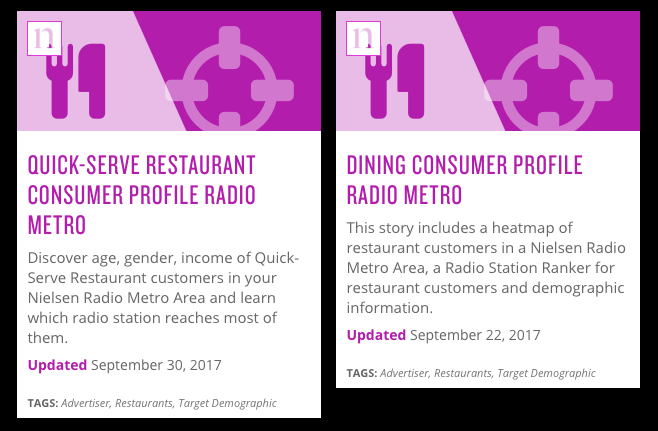
The advertiser-based templates for a restaurant story (click to enlarge)
Use the Scarborough data in these templates to learn more about the restaurant customers in your radio metro.
Show how many people in a radio metro ate at a sit-down or quick-serve restaurant in last 30 days, broken out by ZIP Code.
Provide age, gender, and income for restaurant diners, indexed against the radio metro as a whole.
Rank the diners' preferred TV stations (remember: you can always remove this visualization if it doesn't tell a good story for your station).
Finally, we'll use the station-based templates to see how advertising on your station can help expand a business’s customer base.
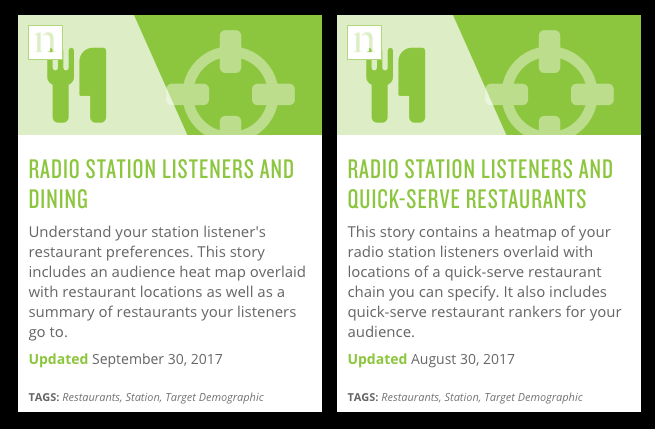
Station-based templates for a restaurant story (click to enlarge)
These templates use AggData and Scarborough data to help you show the reach of your station to the business’s current and future customers.
See where the restaurant locations are on a map, overlaid on your station’s listeners.
Learn the restaurant preferences of your station listeners, indexed against the radio metro as a whole. How does the business you’re pitching rank? (Remember: you can always remove this visualization if it doesn't tell a good story).
If your restaurant (or other business) isn't available in the template input, see Troubleshooting: My business isn't listed in the template input field.
Troubleshooting: My business isn't listed in the template input field
Remember: AggData scrapes the web for data, and it works best for large, national chains. If you are working with smaller, local businesses, they might not be in the AggData dataset. That doesn't mean you can't tell a story about them, though! You'll use a combination of the market, advertiser, and station templates to tell your story, taking pieces of each along the way.
Start with the market-based template, and use a place-holder business -- one that is similar to yours. You won't be able to use the map for your presentation, but the rest of the charts should still provide you with valuable information.
Next, run the consumer profile template for the particular business category you're working in. Because this template is at the radio metro level and does not require a business input, you can use the map from it.
Finally, use the Radio Station Summary in Radius template to enter the specific address(es) of your business. You'll be able to learn a wealth of information about the viewer demographics in the radius surrounding the business.
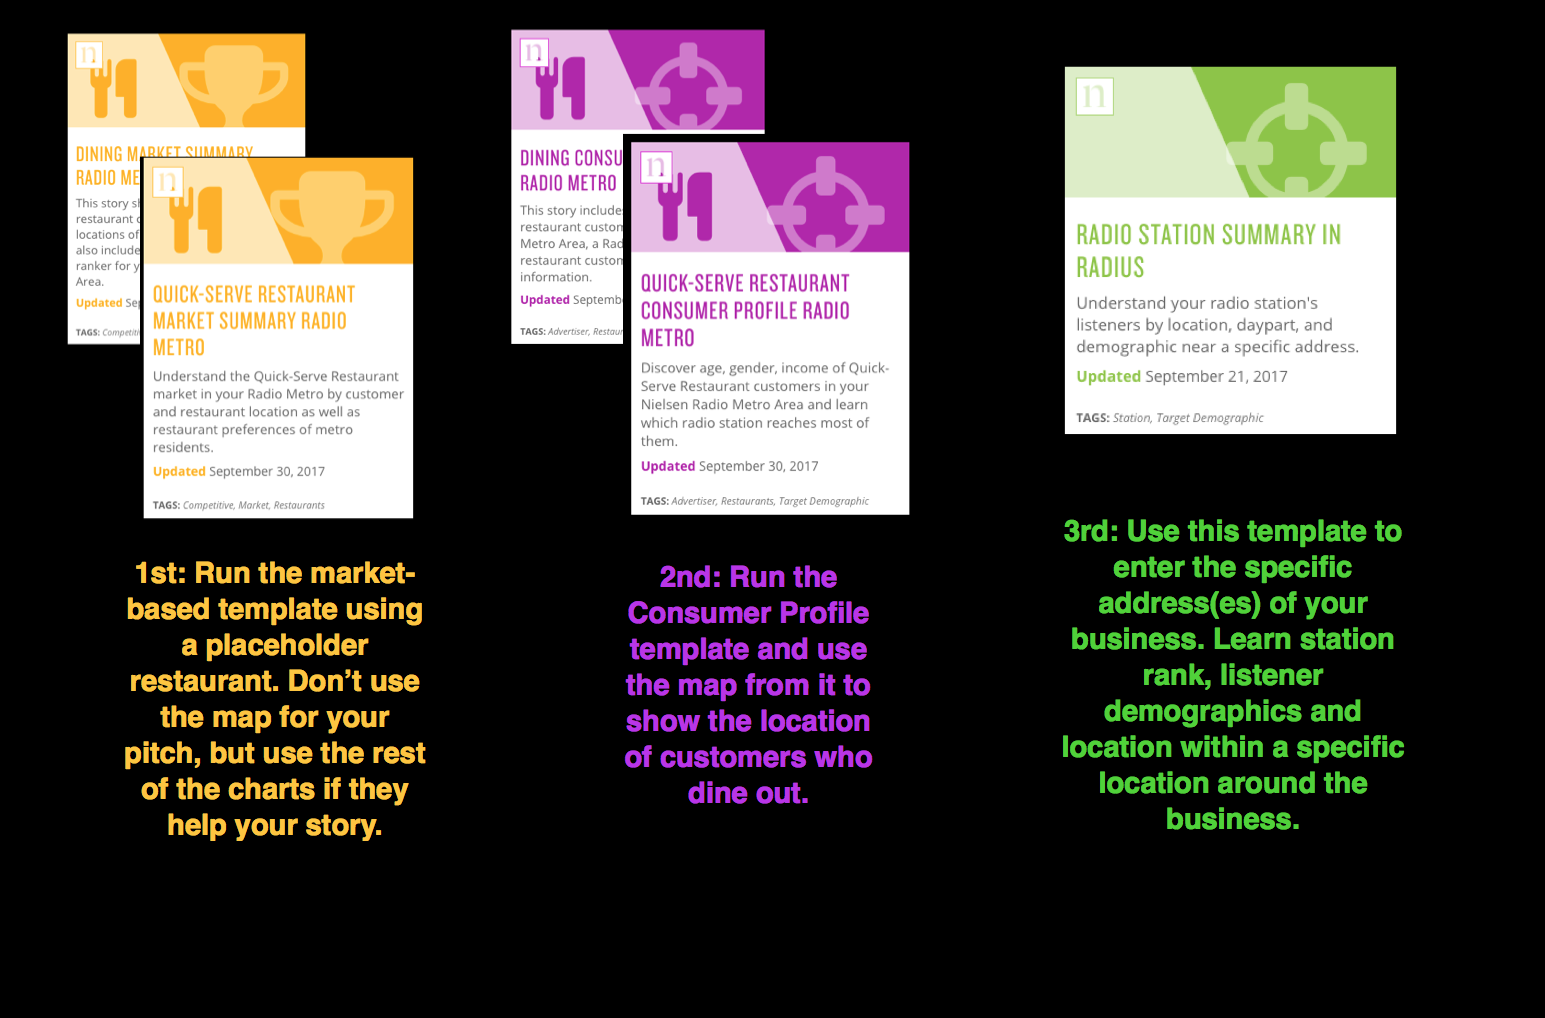
How to tell a business story if you can't find your business in AggData (click to enlarge)
Example: Prospecting
offers several templates that can help you prospect car dealerships and businesses.
Prospecting: Dealer lists
You can use Rhiza templates to prospect auto dealers who aren’t currently clients.
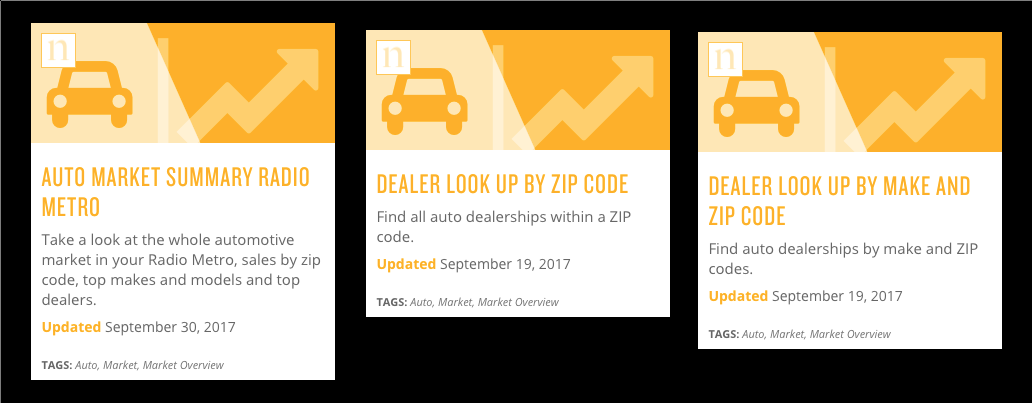
Templates for prospecting car dealerships (click to enlarge)
These templates use Polk data to help you look at the market as a whole to see who is selling what, and also let you find a particular dealer within a ZIP Code.
See a list of all the dealers in your radio metro, ranked by number of sales. Use this information to help you target dealers you want to pitch. [Auto Market Summary Radio Metro]
Use the information on top makes and models to help inform your prospecting decisions. [Auto Market Summary Radio Metro]
Use the look-up templates to find a list of dealers in a ZIP Code. You can narrow it down further by searching for only dealers who sell a certain make in that ZIP Code. Use the list of dealer names and addresses to help inform your prospecting decisions. [Dealer Look Up by ZIP Code & Dealer Look Up by Make and ZIP Code]
Once you find a dealer you want to pitch to, use the auto templates to tell a compelling story. See Example: Creating an auto story in this guide.
Prospecting: Business Lists
These templates use AggData to find business locations in your market based on company name, within a specified ZIP Code, or by SIC Code. An SIC code is a 4-digit classification code created by the government (look up codes at https://www.osha.gov/pls/imis/sicsearch.html); AggData appends a classification phrase after the 4 digits.
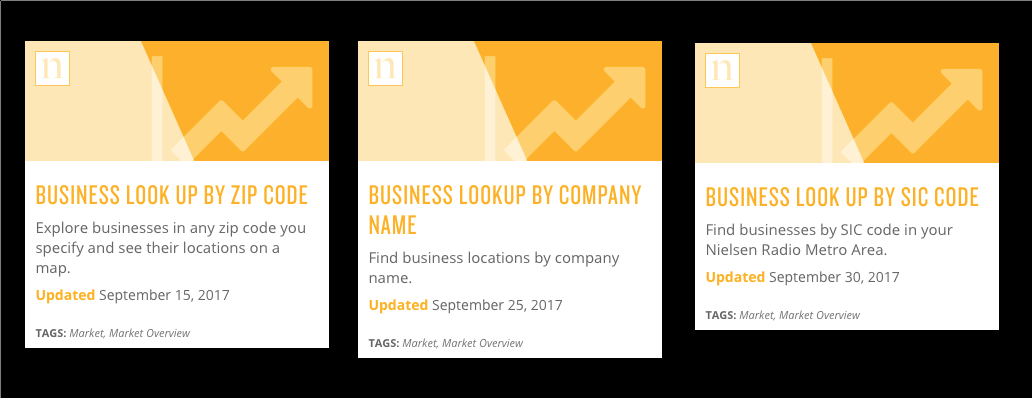
Business look-up templates (click to enlarge)
Once you’ve found the business you want, use the many templates in the business categories to build your pitch. See Example: Creating a business story in this guide.
If your business is local and not in AggData, remember that you can use the radius-based templates to help tell your story: Retail Consumers in Store Radius & Radio Station Summary in Radius.
Want to make your presentations great?
We've got three simple tips to make your sales presentations go from good to great!
Tip 1: Remember that great presentations draw from different templates
You’ll likely use several templates (market-based, advertiser-based, and station-based) to tell the best story. This means you’ll need to do some work before you pitch to your client. (Bonus: you’ll know the data is there and everything looks okay!)
Tip 2: Customize your visualization titles
By default, the titles are generic. Give them names that represent the customer. Make them more enticing. For example, one user turned the viz title Our radio station reaches furniture shoppers to an eye-catching 104,000 KBUE Listeners are Ready to Buy Furniture! and made an impression on his client.
Tip 3: Delete a visualization if it doesn’t tell a great story
Your station or your potential client might not be at the top of a ranker. If a visualization really doesn’t help your story, you can always remove it.